U.S. Virgin Islander vs Immigrants from Turkey College, 1 year or more
COMPARE
U.S. Virgin Islander
Immigrants from Turkey
College, 1 year or more
College, 1 year or more Comparison
U.S. Virgin Islanders
Immigrants from Turkey
54.8%
COLLEGE, 1 YEAR OR MORE
0.3/ 100
METRIC RATING
263rd/ 347
METRIC RANK
65.2%
COLLEGE, 1 YEAR OR MORE
99.9/ 100
METRIC RATING
35th/ 347
METRIC RANK
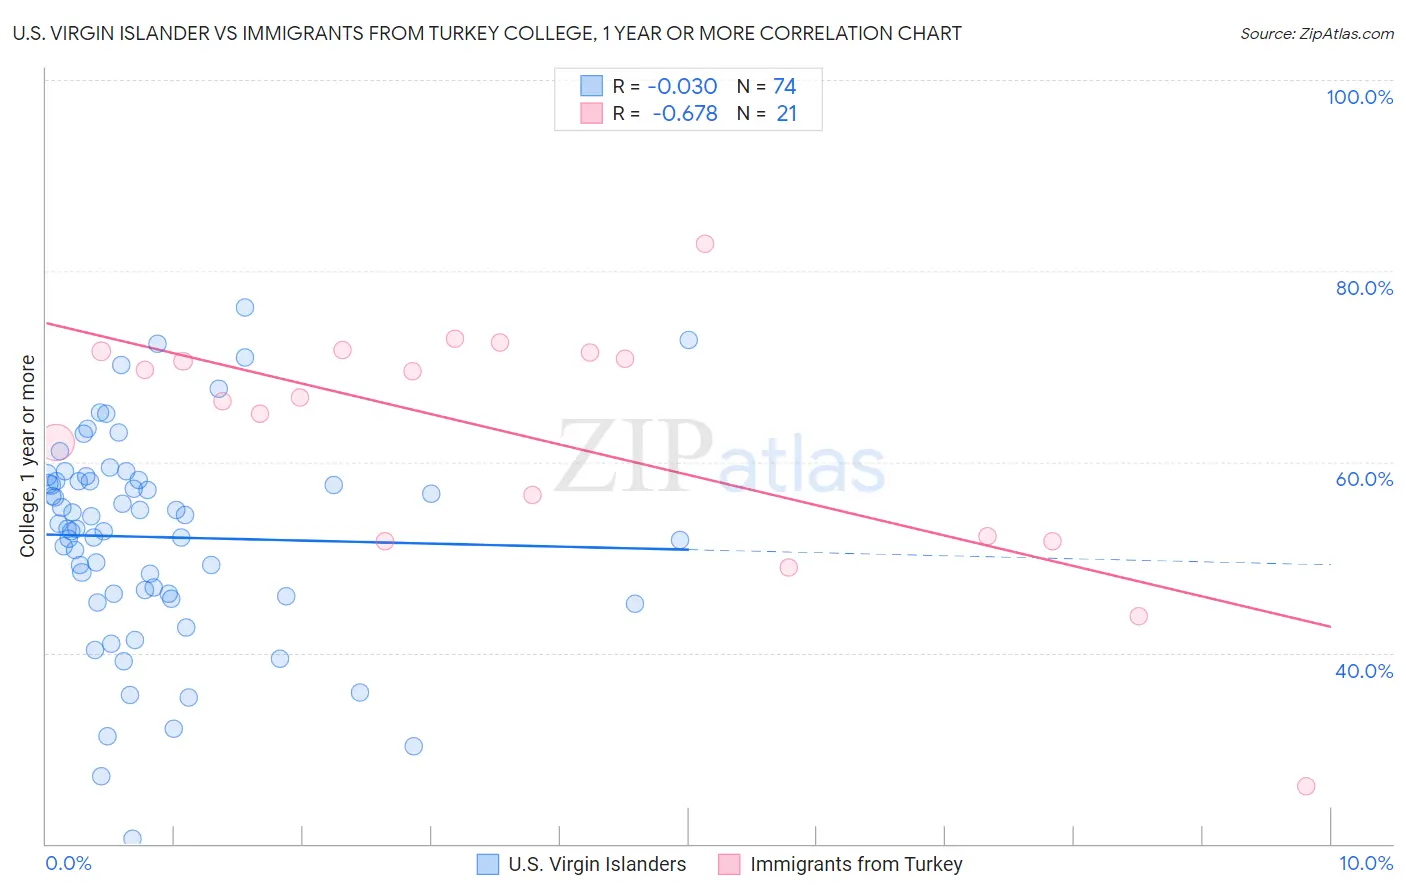
U.S. Virgin Islander vs Immigrants from Turkey College, 1 year or more Correlation Chart
The statistical analysis conducted on geographies consisting of 87,526,675 people shows no correlation between the proportion of U.S. Virgin Islanders and percentage of population with at least college, 1 year or more education in the United States with a correlation coefficient (R) of -0.030 and weighted average of 54.8%. Similarly, the statistical analysis conducted on geographies consisting of 223,057,840 people shows a significant negative correlation between the proportion of Immigrants from Turkey and percentage of population with at least college, 1 year or more education in the United States with a correlation coefficient (R) of -0.678 and weighted average of 65.2%, a difference of 19.0%.
College, 1 year or more Correlation Summary
| Measurement | U.S. Virgin Islander | Immigrants from Turkey |
| Minimum | 20.5% | 26.0% |
| Maximum | 76.2% | 82.8% |
| Range | 55.7% | 56.8% |
| Mean | 52.1% | 62.6% |
| Median | 53.3% | 66.8% |
| Interquartile 25% (IQ1) | 46.2% | 52.0% |
| Interquartile 75% (IQ3) | 58.0% | 71.5% |
| Interquartile Range (IQR) | 11.8% | 19.5% |
| Standard Deviation (Sample) | 10.9% | 13.0% |
| Standard Deviation (Population) | 10.8% | 12.7% |
Similar Demographics by College, 1 year or more
Demographics Similar to U.S. Virgin Islanders by College, 1 year or more
In terms of college, 1 year or more, the demographic groups most similar to U.S. Virgin Islanders are Immigrants from St. Vincent and the Grenadines (54.8%, a difference of 0.020%), Immigrants from Micronesia (54.8%, a difference of 0.020%), Ottawa (54.9%, a difference of 0.11%), Jamaican (54.9%, a difference of 0.13%), and Immigrants from Laos (54.7%, a difference of 0.22%).
| Demographics | Rating | Rank | College, 1 year or more |
| Immigrants | West Indies | 0.5 /100 | #256 | Tragic 55.2% |
| Indonesians | 0.4 /100 | #257 | Tragic 55.1% |
| Africans | 0.4 /100 | #258 | Tragic 55.0% |
| Nepalese | 0.3 /100 | #259 | Tragic 54.9% |
| Jamaicans | 0.3 /100 | #260 | Tragic 54.9% |
| Ottawa | 0.3 /100 | #261 | Tragic 54.9% |
| Immigrants | St. Vincent and the Grenadines | 0.3 /100 | #262 | Tragic 54.8% |
| U.S. Virgin Islanders | 0.3 /100 | #263 | Tragic 54.8% |
| Immigrants | Micronesia | 0.3 /100 | #264 | Tragic 54.8% |
| Immigrants | Laos | 0.2 /100 | #265 | Tragic 54.7% |
| Potawatomi | 0.2 /100 | #266 | Tragic 54.6% |
| Blackfeet | 0.2 /100 | #267 | Tragic 54.6% |
| British West Indians | 0.2 /100 | #268 | Tragic 54.5% |
| Bangladeshis | 0.2 /100 | #269 | Tragic 54.5% |
| Crow | 0.2 /100 | #270 | Tragic 54.5% |
Demographics Similar to Immigrants from Turkey by College, 1 year or more
In terms of college, 1 year or more, the demographic groups most similar to Immigrants from Turkey are Immigrants from South Africa (65.1%, a difference of 0.080%), Russian (65.1%, a difference of 0.090%), Israeli (65.3%, a difference of 0.20%), Immigrants from Saudi Arabia (65.0%, a difference of 0.24%), and Estonian (65.0%, a difference of 0.31%).
| Demographics | Rating | Rank | College, 1 year or more |
| Immigrants | France | 100.0 /100 | #28 | Exceptional 65.8% |
| Immigrants | Northern Europe | 100.0 /100 | #29 | Exceptional 65.6% |
| Immigrants | Denmark | 100.0 /100 | #30 | Exceptional 65.6% |
| Turks | 100.0 /100 | #31 | Exceptional 65.5% |
| Bulgarians | 100.0 /100 | #32 | Exceptional 65.5% |
| Immigrants | Sri Lanka | 99.9 /100 | #33 | Exceptional 65.4% |
| Israelis | 99.9 /100 | #34 | Exceptional 65.3% |
| Immigrants | Turkey | 99.9 /100 | #35 | Exceptional 65.2% |
| Immigrants | South Africa | 99.9 /100 | #36 | Exceptional 65.1% |
| Russians | 99.9 /100 | #37 | Exceptional 65.1% |
| Immigrants | Saudi Arabia | 99.9 /100 | #38 | Exceptional 65.0% |
| Estonians | 99.9 /100 | #39 | Exceptional 65.0% |
| Immigrants | Kuwait | 99.9 /100 | #40 | Exceptional 65.0% |
| Mongolians | 99.9 /100 | #41 | Exceptional 64.8% |
| Immigrants | Latvia | 99.9 /100 | #42 | Exceptional 64.8% |