U.S. Virgin Islander vs Luxembourger Doctorate Degree
COMPARE
U.S. Virgin Islander
Luxembourger
Doctorate Degree
Doctorate Degree Comparison
U.S. Virgin Islanders
Luxembourgers
1.5%
DOCTORATE DEGREE
0.5/ 100
METRIC RATING
268th/ 347
METRIC RANK
1.9%
DOCTORATE DEGREE
81.1/ 100
METRIC RATING
148th/ 347
METRIC RANK
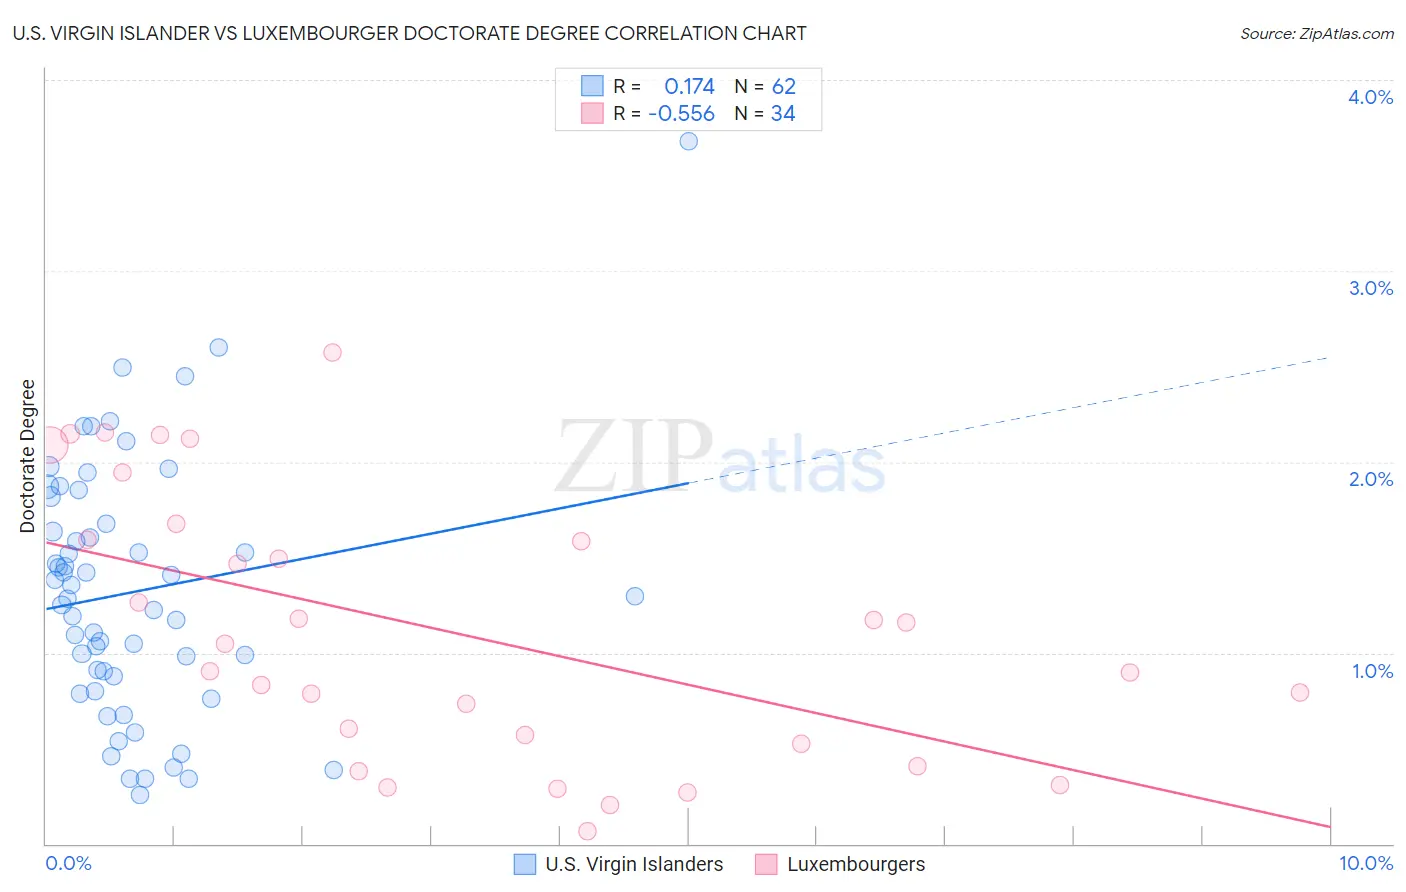
U.S. Virgin Islander vs Luxembourger Doctorate Degree Correlation Chart
The statistical analysis conducted on geographies consisting of 87,354,838 people shows a poor positive correlation between the proportion of U.S. Virgin Islanders and percentage of population with at least doctorate degree education in the United States with a correlation coefficient (R) of 0.174 and weighted average of 1.5%. Similarly, the statistical analysis conducted on geographies consisting of 144,093,078 people shows a substantial negative correlation between the proportion of Luxembourgers and percentage of population with at least doctorate degree education in the United States with a correlation coefficient (R) of -0.556 and weighted average of 1.9%, a difference of 31.0%.
Doctorate Degree Correlation Summary
| Measurement | U.S. Virgin Islander | Luxembourger |
| Minimum | 0.26% | 0.063% |
| Maximum | 3.7% | 2.6% |
| Range | 3.4% | 2.5% |
| Mean | 1.3% | 1.1% |
| Median | 1.3% | 0.98% |
| Interquartile 25% (IQ1) | 0.87% | 0.52% |
| Interquartile 75% (IQ3) | 1.7% | 1.6% |
| Interquartile Range (IQR) | 0.80% | 1.1% |
| Standard Deviation (Sample) | 0.67% | 0.70% |
| Standard Deviation (Population) | 0.66% | 0.69% |
Similar Demographics by Doctorate Degree
Demographics Similar to U.S. Virgin Islanders by Doctorate Degree
In terms of doctorate degree, the demographic groups most similar to U.S. Virgin Islanders are Kiowa (1.5%, a difference of 0.0%), Crow (1.5%, a difference of 0.090%), Salvadoran (1.5%, a difference of 0.11%), Immigrants from Trinidad and Tobago (1.5%, a difference of 0.19%), and Immigrants from Barbados (1.5%, a difference of 0.27%).
| Demographics | Rating | Rank | Doctorate Degree |
| Immigrants | Portugal | 0.8 /100 | #261 | Tragic 1.5% |
| Chickasaw | 0.7 /100 | #262 | Tragic 1.5% |
| Immigrants | Bahamas | 0.7 /100 | #263 | Tragic 1.5% |
| Blackfeet | 0.7 /100 | #264 | Tragic 1.5% |
| Nicaraguans | 0.6 /100 | #265 | Tragic 1.5% |
| Immigrants | Liberia | 0.5 /100 | #266 | Tragic 1.5% |
| Kiowa | 0.5 /100 | #267 | Tragic 1.5% |
| U.S. Virgin Islanders | 0.5 /100 | #268 | Tragic 1.5% |
| Crow | 0.5 /100 | #269 | Tragic 1.5% |
| Salvadorans | 0.5 /100 | #270 | Tragic 1.5% |
| Immigrants | Trinidad and Tobago | 0.5 /100 | #271 | Tragic 1.5% |
| Immigrants | Barbados | 0.4 /100 | #272 | Tragic 1.5% |
| Sioux | 0.4 /100 | #273 | Tragic 1.5% |
| Yaqui | 0.4 /100 | #274 | Tragic 1.5% |
| Aleuts | 0.4 /100 | #275 | Tragic 1.5% |
Demographics Similar to Luxembourgers by Doctorate Degree
In terms of doctorate degree, the demographic groups most similar to Luxembourgers are Immigrants from Senegal (1.9%, a difference of 0.33%), Immigrants from Syria (1.9%, a difference of 0.58%), Kenyan (1.9%, a difference of 0.60%), Immigrants from Moldova (2.0%, a difference of 0.78%), and Basque (1.9%, a difference of 0.90%).
| Demographics | Rating | Rank | Doctorate Degree |
| Senegalese | 86.7 /100 | #141 | Excellent 2.0% |
| Italians | 86.0 /100 | #142 | Excellent 2.0% |
| Sierra Leoneans | 85.1 /100 | #143 | Excellent 2.0% |
| Immigrants | Moldova | 84.3 /100 | #144 | Excellent 2.0% |
| Kenyans | 83.6 /100 | #145 | Excellent 1.9% |
| Immigrants | Syria | 83.6 /100 | #146 | Excellent 1.9% |
| Immigrants | Senegal | 82.5 /100 | #147 | Excellent 1.9% |
| Luxembourgers | 81.1 /100 | #148 | Excellent 1.9% |
| Basques | 76.9 /100 | #149 | Good 1.9% |
| English | 75.9 /100 | #150 | Good 1.9% |
| Albanians | 74.8 /100 | #151 | Good 1.9% |
| Immigrants | Kenya | 74.3 /100 | #152 | Good 1.9% |
| Immigrants | Oceania | 74.0 /100 | #153 | Good 1.9% |
| Immigrants | Albania | 72.8 /100 | #154 | Good 1.9% |
| Poles | 72.7 /100 | #155 | Good 1.9% |