U.S. Virgin Islander vs Northern European Doctorate Degree
COMPARE
U.S. Virgin Islander
Northern European
Doctorate Degree
Doctorate Degree Comparison
U.S. Virgin Islanders
Northern Europeans
1.5%
DOCTORATE DEGREE
0.5/ 100
METRIC RATING
268th/ 347
METRIC RANK
2.2%
DOCTORATE DEGREE
99.7/ 100
METRIC RATING
79th/ 347
METRIC RANK
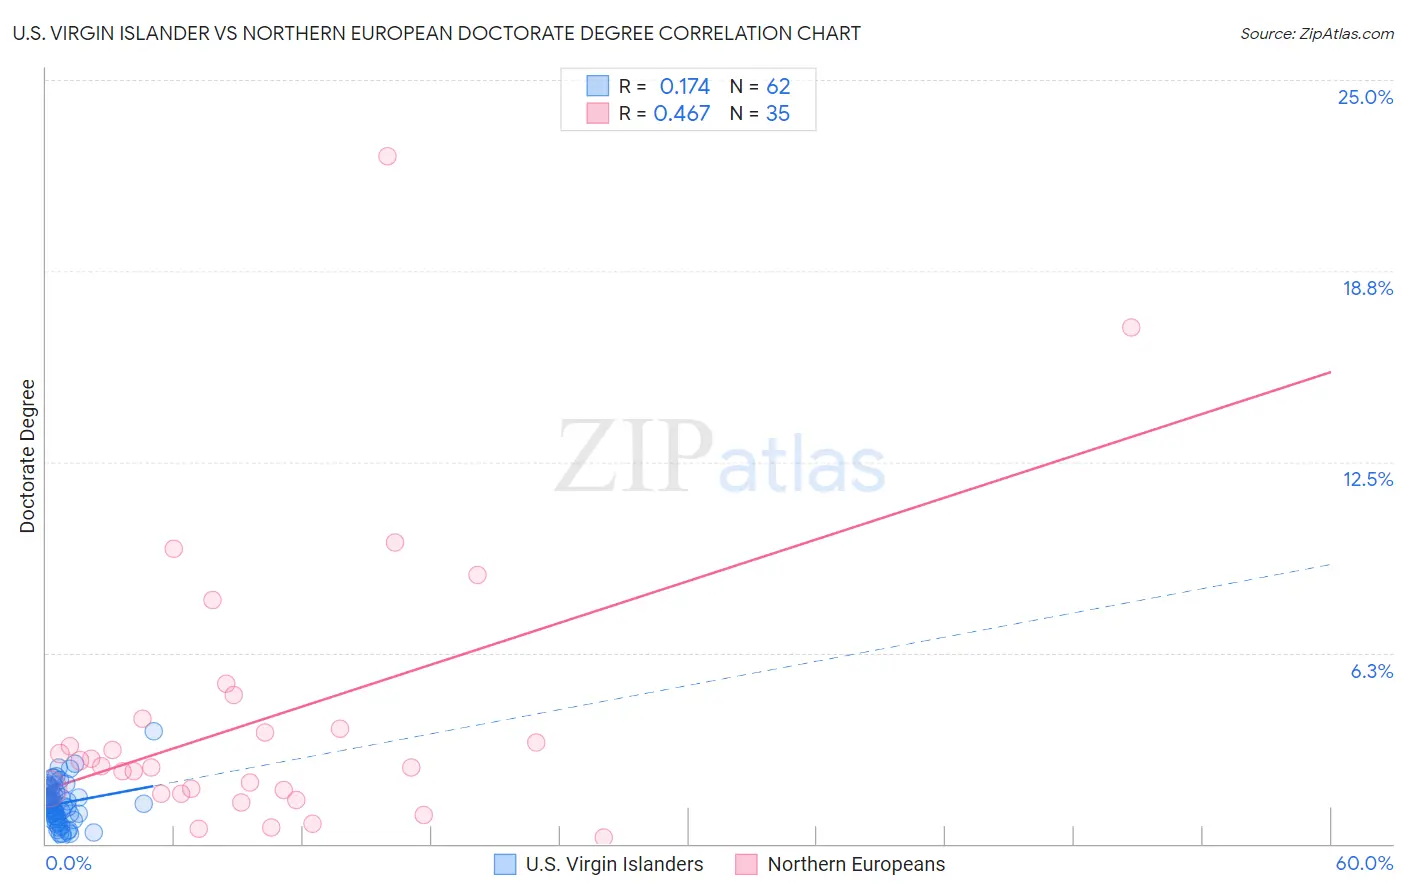
U.S. Virgin Islander vs Northern European Doctorate Degree Correlation Chart
The statistical analysis conducted on geographies consisting of 87,354,838 people shows a poor positive correlation between the proportion of U.S. Virgin Islanders and percentage of population with at least doctorate degree education in the United States with a correlation coefficient (R) of 0.174 and weighted average of 1.5%. Similarly, the statistical analysis conducted on geographies consisting of 401,433,855 people shows a moderate positive correlation between the proportion of Northern Europeans and percentage of population with at least doctorate degree education in the United States with a correlation coefficient (R) of 0.467 and weighted average of 2.2%, a difference of 51.0%.
Doctorate Degree Correlation Summary
| Measurement | U.S. Virgin Islander | Northern European |
| Minimum | 0.26% | 0.22% |
| Maximum | 3.7% | 22.5% |
| Range | 3.4% | 22.3% |
| Mean | 1.3% | 4.1% |
| Median | 1.3% | 2.5% |
| Interquartile 25% (IQ1) | 0.87% | 1.6% |
| Interquartile 75% (IQ3) | 1.7% | 4.1% |
| Interquartile Range (IQR) | 0.80% | 2.5% |
| Standard Deviation (Sample) | 0.67% | 4.7% |
| Standard Deviation (Population) | 0.66% | 4.6% |
Similar Demographics by Doctorate Degree
Demographics Similar to U.S. Virgin Islanders by Doctorate Degree
In terms of doctorate degree, the demographic groups most similar to U.S. Virgin Islanders are Kiowa (1.5%, a difference of 0.0%), Crow (1.5%, a difference of 0.090%), Salvadoran (1.5%, a difference of 0.11%), Immigrants from Trinidad and Tobago (1.5%, a difference of 0.19%), and Immigrants from Barbados (1.5%, a difference of 0.27%).
| Demographics | Rating | Rank | Doctorate Degree |
| Immigrants | Portugal | 0.8 /100 | #261 | Tragic 1.5% |
| Chickasaw | 0.7 /100 | #262 | Tragic 1.5% |
| Immigrants | Bahamas | 0.7 /100 | #263 | Tragic 1.5% |
| Blackfeet | 0.7 /100 | #264 | Tragic 1.5% |
| Nicaraguans | 0.6 /100 | #265 | Tragic 1.5% |
| Immigrants | Liberia | 0.5 /100 | #266 | Tragic 1.5% |
| Kiowa | 0.5 /100 | #267 | Tragic 1.5% |
| U.S. Virgin Islanders | 0.5 /100 | #268 | Tragic 1.5% |
| Crow | 0.5 /100 | #269 | Tragic 1.5% |
| Salvadorans | 0.5 /100 | #270 | Tragic 1.5% |
| Immigrants | Trinidad and Tobago | 0.5 /100 | #271 | Tragic 1.5% |
| Immigrants | Barbados | 0.4 /100 | #272 | Tragic 1.5% |
| Sioux | 0.4 /100 | #273 | Tragic 1.5% |
| Yaqui | 0.4 /100 | #274 | Tragic 1.5% |
| Aleuts | 0.4 /100 | #275 | Tragic 1.5% |
Demographics Similar to Northern Europeans by Doctorate Degree
In terms of doctorate degree, the demographic groups most similar to Northern Europeans are Immigrants from Belarus (2.2%, a difference of 0.070%), Ugandan (2.2%, a difference of 0.28%), Immigrants from Argentina (2.2%, a difference of 0.34%), Immigrants from Lebanon (2.2%, a difference of 0.59%), and Immigrants from Hungary (2.2%, a difference of 0.60%).
| Demographics | Rating | Rank | Doctorate Degree |
| Immigrants | Canada | 99.8 /100 | #72 | Exceptional 2.3% |
| Immigrants | Bulgaria | 99.8 /100 | #73 | Exceptional 2.3% |
| Immigrants | North America | 99.8 /100 | #74 | Exceptional 2.2% |
| Immigrants | Western Asia | 99.8 /100 | #75 | Exceptional 2.2% |
| Immigrants | Hungary | 99.8 /100 | #76 | Exceptional 2.2% |
| Immigrants | Lebanon | 99.8 /100 | #77 | Exceptional 2.2% |
| Immigrants | Belarus | 99.7 /100 | #78 | Exceptional 2.2% |
| Northern Europeans | 99.7 /100 | #79 | Exceptional 2.2% |
| Ugandans | 99.7 /100 | #80 | Exceptional 2.2% |
| Immigrants | Argentina | 99.7 /100 | #81 | Exceptional 2.2% |
| Immigrants | Uganda | 99.6 /100 | #82 | Exceptional 2.2% |
| Immigrants | Lithuania | 99.6 /100 | #83 | Exceptional 2.2% |
| Immigrants | England | 99.6 /100 | #84 | Exceptional 2.2% |
| Immigrants | Brazil | 99.6 /100 | #85 | Exceptional 2.2% |
| Egyptians | 99.4 /100 | #86 | Exceptional 2.2% |