Alaska Native vs Jordanian Doctorate Degree
COMPARE
Alaska Native
Jordanian
Doctorate Degree
Doctorate Degree Comparison
Alaska Natives
Jordanians
1.4%
DOCTORATE DEGREE
0.3/ 100
METRIC RATING
292nd/ 347
METRIC RANK
2.0%
DOCTORATE DEGREE
92.1/ 100
METRIC RATING
126th/ 347
METRIC RANK
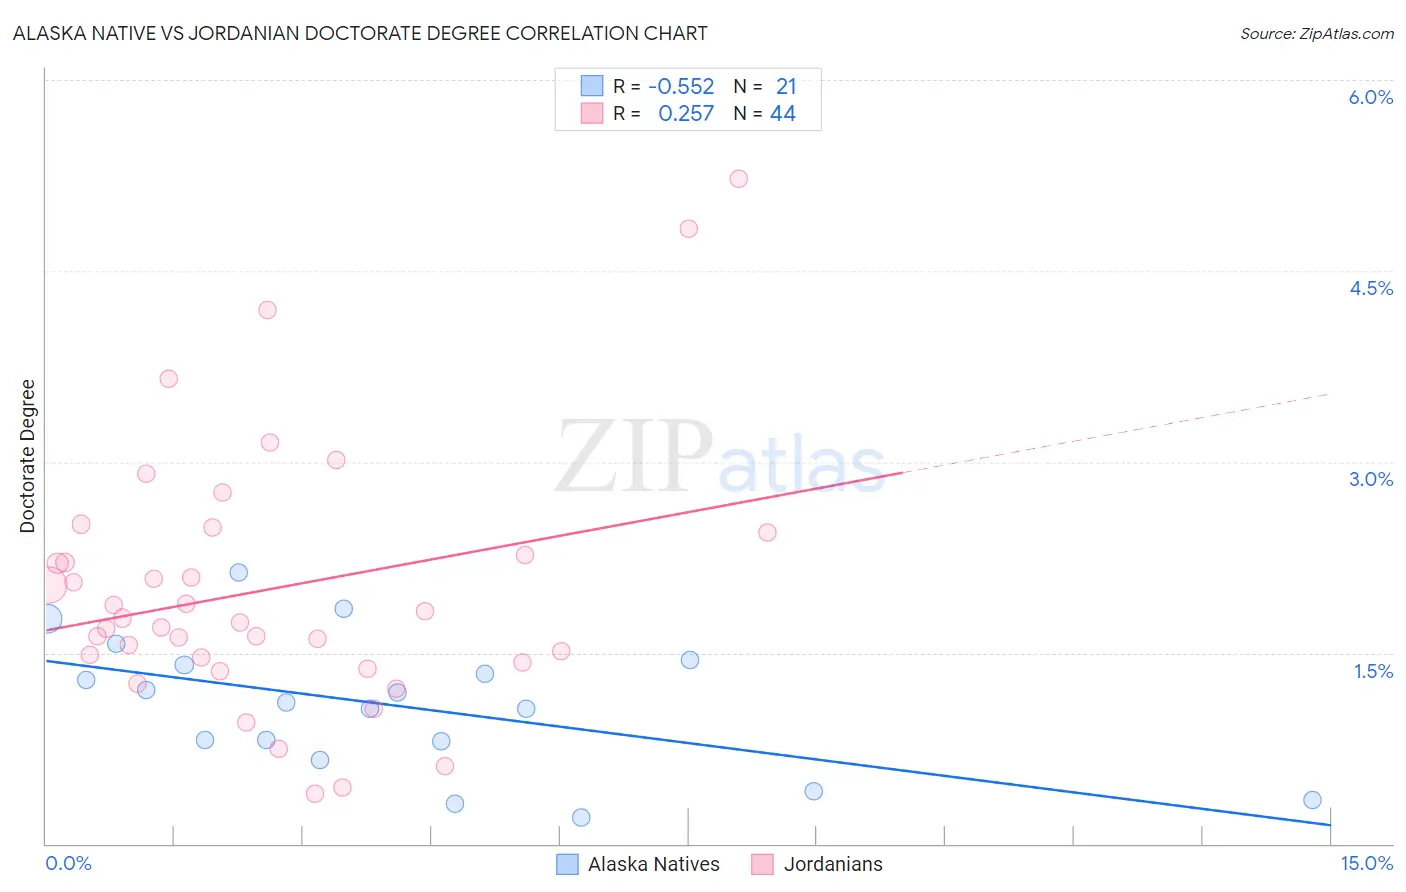
Alaska Native vs Jordanian Doctorate Degree Correlation Chart
The statistical analysis conducted on geographies consisting of 76,370,977 people shows a substantial negative correlation between the proportion of Alaska Natives and percentage of population with at least doctorate degree education in the United States with a correlation coefficient (R) of -0.552 and weighted average of 1.4%. Similarly, the statistical analysis conducted on geographies consisting of 166,045,930 people shows a weak positive correlation between the proportion of Jordanians and percentage of population with at least doctorate degree education in the United States with a correlation coefficient (R) of 0.257 and weighted average of 2.0%, a difference of 39.2%.
Doctorate Degree Correlation Summary
| Measurement | Alaska Native | Jordanian |
| Minimum | 0.21% | 0.39% |
| Maximum | 2.1% | 5.2% |
| Range | 1.9% | 4.8% |
| Mean | 1.1% | 2.0% |
| Median | 1.1% | 1.8% |
| Interquartile 25% (IQ1) | 0.73% | 1.4% |
| Interquartile 75% (IQ3) | 1.4% | 2.4% |
| Interquartile Range (IQR) | 0.69% | 0.91% |
| Standard Deviation (Sample) | 0.53% | 1.0% |
| Standard Deviation (Population) | 0.51% | 1.0% |
Similar Demographics by Doctorate Degree
Demographics Similar to Alaska Natives by Doctorate Degree
In terms of doctorate degree, the demographic groups most similar to Alaska Natives are Black/African American (1.4%, a difference of 0.17%), Choctaw (1.4%, a difference of 0.40%), Cape Verdean (1.4%, a difference of 0.42%), Immigrants from El Salvador (1.4%, a difference of 0.55%), and Immigrants from Yemen (1.4%, a difference of 0.59%).
| Demographics | Rating | Rank | Doctorate Degree |
| Malaysians | 0.3 /100 | #285 | Tragic 1.5% |
| Cherokee | 0.3 /100 | #286 | Tragic 1.5% |
| Cajuns | 0.3 /100 | #287 | Tragic 1.5% |
| Immigrants | El Salvador | 0.3 /100 | #288 | Tragic 1.4% |
| Cape Verdeans | 0.3 /100 | #289 | Tragic 1.4% |
| Choctaw | 0.3 /100 | #290 | Tragic 1.4% |
| Blacks/African Americans | 0.3 /100 | #291 | Tragic 1.4% |
| Alaska Natives | 0.3 /100 | #292 | Tragic 1.4% |
| Immigrants | Yemen | 0.2 /100 | #293 | Tragic 1.4% |
| Samoans | 0.2 /100 | #294 | Tragic 1.4% |
| Guatemalans | 0.2 /100 | #295 | Tragic 1.4% |
| Immigrants | Ecuador | 0.2 /100 | #296 | Tragic 1.4% |
| Tsimshian | 0.2 /100 | #297 | Tragic 1.4% |
| Puerto Ricans | 0.1 /100 | #298 | Tragic 1.4% |
| Belizeans | 0.1 /100 | #299 | Tragic 1.4% |
Demographics Similar to Jordanians by Doctorate Degree
In terms of doctorate degree, the demographic groups most similar to Jordanians are Palestinian (2.0%, a difference of 0.040%), Moroccan (2.0%, a difference of 0.42%), Immigrants from Zaire (2.0%, a difference of 0.46%), Ute (2.0%, a difference of 0.52%), and Canadian (2.0%, a difference of 0.67%).
| Demographics | Rating | Rank | Doctorate Degree |
| Pakistanis | 95.8 /100 | #119 | Exceptional 2.0% |
| Immigrants | Morocco | 95.5 /100 | #120 | Exceptional 2.0% |
| Immigrants | Jordan | 94.8 /100 | #121 | Exceptional 2.0% |
| Immigrants | Southern Europe | 94.7 /100 | #122 | Exceptional 2.0% |
| Croatians | 94.0 /100 | #123 | Exceptional 2.0% |
| Ute | 93.2 /100 | #124 | Exceptional 2.0% |
| Moroccans | 93.0 /100 | #125 | Exceptional 2.0% |
| Jordanians | 92.1 /100 | #126 | Exceptional 2.0% |
| Palestinians | 92.0 /100 | #127 | Exceptional 2.0% |
| Immigrants | Zaire | 91.1 /100 | #128 | Exceptional 2.0% |
| Canadians | 90.6 /100 | #129 | Exceptional 2.0% |
| Immigrants | Ukraine | 90.5 /100 | #130 | Exceptional 2.0% |
| Immigrants | Sierra Leone | 90.2 /100 | #131 | Exceptional 2.0% |
| Scottish | 89.4 /100 | #132 | Excellent 2.0% |
| Immigrants | Uzbekistan | 89.3 /100 | #133 | Excellent 2.0% |