English vs Jordanian Doctorate Degree
COMPARE
English
Jordanian
Doctorate Degree
Doctorate Degree Comparison
English
Jordanians
1.9%
DOCTORATE DEGREE
75.9/ 100
METRIC RATING
150th/ 347
METRIC RANK
2.0%
DOCTORATE DEGREE
92.1/ 100
METRIC RATING
126th/ 347
METRIC RANK
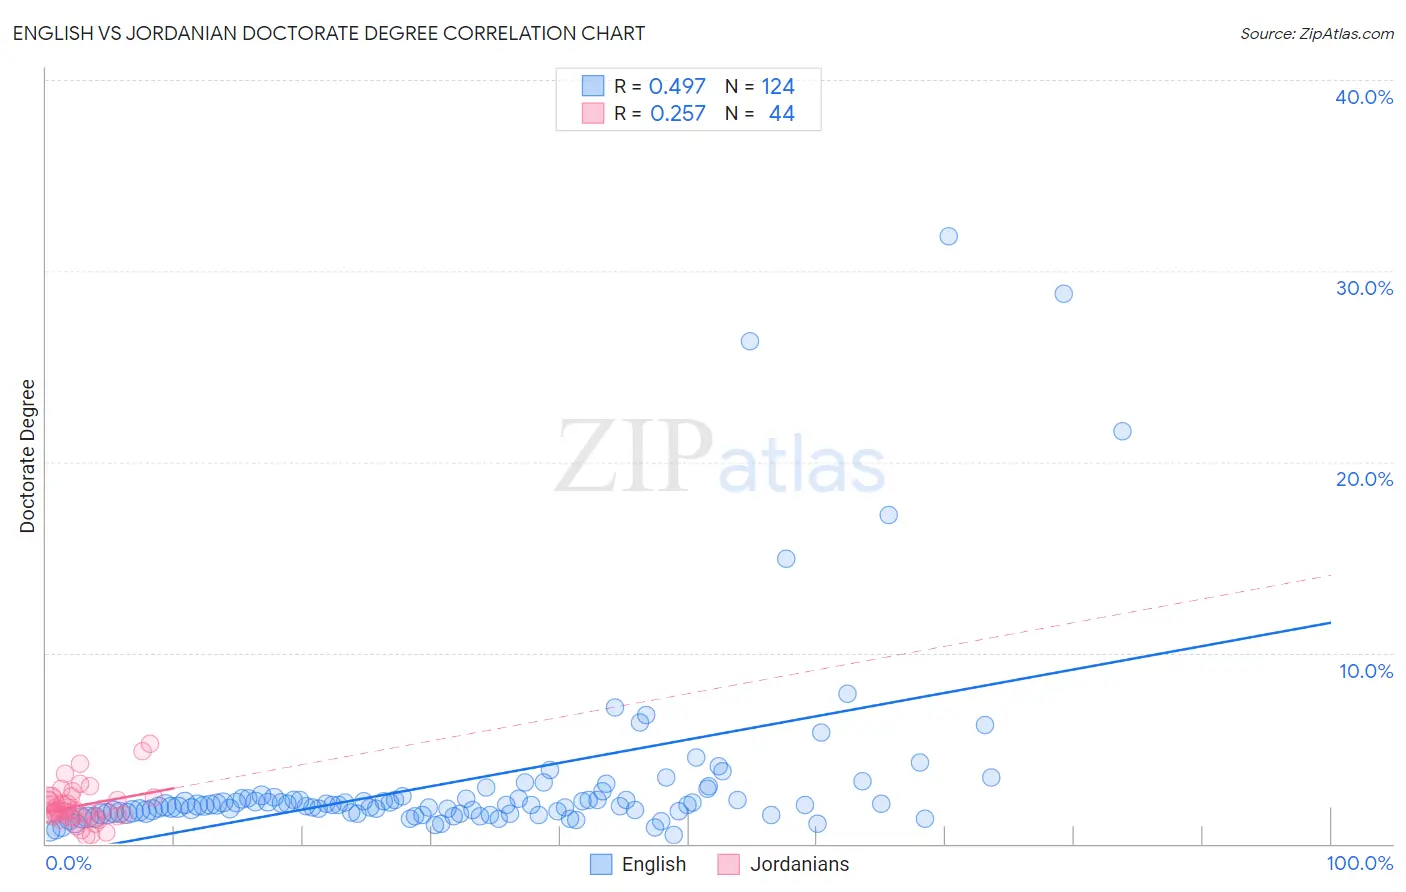
English vs Jordanian Doctorate Degree Correlation Chart
The statistical analysis conducted on geographies consisting of 550,351,908 people shows a moderate positive correlation between the proportion of English and percentage of population with at least doctorate degree education in the United States with a correlation coefficient (R) of 0.497 and weighted average of 1.9%. Similarly, the statistical analysis conducted on geographies consisting of 166,045,930 people shows a weak positive correlation between the proportion of Jordanians and percentage of population with at least doctorate degree education in the United States with a correlation coefficient (R) of 0.257 and weighted average of 2.0%, a difference of 4.6%.
Doctorate Degree Correlation Summary
| Measurement | English | Jordanian |
| Minimum | 0.49% | 0.39% |
| Maximum | 31.8% | 5.2% |
| Range | 31.3% | 4.8% |
| Mean | 3.3% | 2.0% |
| Median | 2.0% | 1.8% |
| Interquartile 25% (IQ1) | 1.6% | 1.4% |
| Interquartile 75% (IQ3) | 2.4% | 2.4% |
| Interquartile Range (IQR) | 0.77% | 0.91% |
| Standard Deviation (Sample) | 4.9% | 1.0% |
| Standard Deviation (Population) | 4.9% | 1.0% |
Similar Demographics by Doctorate Degree
Demographics Similar to English by Doctorate Degree
In terms of doctorate degree, the demographic groups most similar to English are Albanian (1.9%, a difference of 0.19%), Basque (1.9%, a difference of 0.20%), Immigrants from Kenya (1.9%, a difference of 0.30%), Immigrants from Oceania (1.9%, a difference of 0.34%), and Immigrants from Albania (1.9%, a difference of 0.57%).
| Demographics | Rating | Rank | Doctorate Degree |
| Sierra Leoneans | 85.1 /100 | #143 | Excellent 2.0% |
| Immigrants | Moldova | 84.3 /100 | #144 | Excellent 2.0% |
| Kenyans | 83.6 /100 | #145 | Excellent 1.9% |
| Immigrants | Syria | 83.6 /100 | #146 | Excellent 1.9% |
| Immigrants | Senegal | 82.5 /100 | #147 | Excellent 1.9% |
| Luxembourgers | 81.1 /100 | #148 | Excellent 1.9% |
| Basques | 76.9 /100 | #149 | Good 1.9% |
| English | 75.9 /100 | #150 | Good 1.9% |
| Albanians | 74.8 /100 | #151 | Good 1.9% |
| Immigrants | Kenya | 74.3 /100 | #152 | Good 1.9% |
| Immigrants | Oceania | 74.0 /100 | #153 | Good 1.9% |
| Immigrants | Albania | 72.8 /100 | #154 | Good 1.9% |
| Poles | 72.7 /100 | #155 | Good 1.9% |
| Slavs | 72.4 /100 | #156 | Good 1.9% |
| Danes | 71.9 /100 | #157 | Good 1.9% |
Demographics Similar to Jordanians by Doctorate Degree
In terms of doctorate degree, the demographic groups most similar to Jordanians are Palestinian (2.0%, a difference of 0.040%), Moroccan (2.0%, a difference of 0.42%), Immigrants from Zaire (2.0%, a difference of 0.46%), Ute (2.0%, a difference of 0.52%), and Canadian (2.0%, a difference of 0.67%).
| Demographics | Rating | Rank | Doctorate Degree |
| Pakistanis | 95.8 /100 | #119 | Exceptional 2.0% |
| Immigrants | Morocco | 95.5 /100 | #120 | Exceptional 2.0% |
| Immigrants | Jordan | 94.8 /100 | #121 | Exceptional 2.0% |
| Immigrants | Southern Europe | 94.7 /100 | #122 | Exceptional 2.0% |
| Croatians | 94.0 /100 | #123 | Exceptional 2.0% |
| Ute | 93.2 /100 | #124 | Exceptional 2.0% |
| Moroccans | 93.0 /100 | #125 | Exceptional 2.0% |
| Jordanians | 92.1 /100 | #126 | Exceptional 2.0% |
| Palestinians | 92.0 /100 | #127 | Exceptional 2.0% |
| Immigrants | Zaire | 91.1 /100 | #128 | Exceptional 2.0% |
| Canadians | 90.6 /100 | #129 | Exceptional 2.0% |
| Immigrants | Ukraine | 90.5 /100 | #130 | Exceptional 2.0% |
| Immigrants | Sierra Leone | 90.2 /100 | #131 | Exceptional 2.0% |
| Scottish | 89.4 /100 | #132 | Excellent 2.0% |
| Immigrants | Uzbekistan | 89.3 /100 | #133 | Excellent 2.0% |