U.S. Virgin Islander vs Pennsylvania German Doctorate Degree
COMPARE
U.S. Virgin Islander
Pennsylvania German
Doctorate Degree
Doctorate Degree Comparison
U.S. Virgin Islanders
Pennsylvania Germans
1.5%
DOCTORATE DEGREE
0.5/ 100
METRIC RATING
268th/ 347
METRIC RANK
1.4%
DOCTORATE DEGREE
0.1/ 100
METRIC RATING
305th/ 347
METRIC RANK
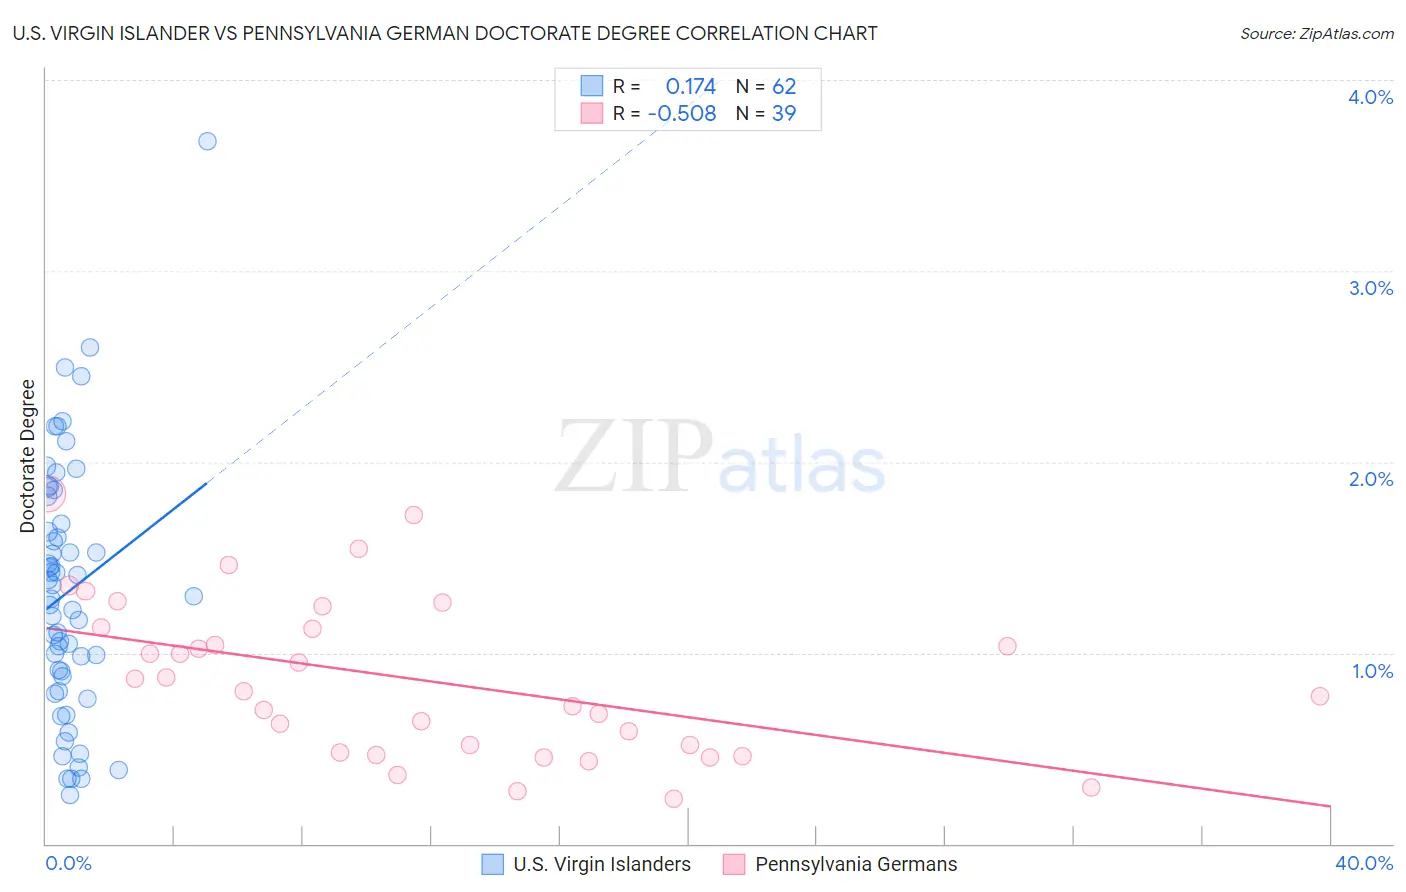
U.S. Virgin Islander vs Pennsylvania German Doctorate Degree Correlation Chart
The statistical analysis conducted on geographies consisting of 87,354,838 people shows a poor positive correlation between the proportion of U.S. Virgin Islanders and percentage of population with at least doctorate degree education in the United States with a correlation coefficient (R) of 0.174 and weighted average of 1.5%. Similarly, the statistical analysis conducted on geographies consisting of 230,381,688 people shows a substantial negative correlation between the proportion of Pennsylvania Germans and percentage of population with at least doctorate degree education in the United States with a correlation coefficient (R) of -0.508 and weighted average of 1.4%, a difference of 7.1%.
Doctorate Degree Correlation Summary
| Measurement | U.S. Virgin Islander | Pennsylvania German |
| Minimum | 0.26% | 0.24% |
| Maximum | 3.7% | 1.8% |
| Range | 3.4% | 1.6% |
| Mean | 1.3% | 0.86% |
| Median | 1.3% | 0.80% |
| Interquartile 25% (IQ1) | 0.87% | 0.48% |
| Interquartile 75% (IQ3) | 1.7% | 1.1% |
| Interquartile Range (IQR) | 0.80% | 0.65% |
| Standard Deviation (Sample) | 0.67% | 0.41% |
| Standard Deviation (Population) | 0.66% | 0.41% |
Similar Demographics by Doctorate Degree
Demographics Similar to U.S. Virgin Islanders by Doctorate Degree
In terms of doctorate degree, the demographic groups most similar to U.S. Virgin Islanders are Kiowa (1.5%, a difference of 0.0%), Crow (1.5%, a difference of 0.090%), Salvadoran (1.5%, a difference of 0.11%), Immigrants from Trinidad and Tobago (1.5%, a difference of 0.19%), and Immigrants from Barbados (1.5%, a difference of 0.27%).
| Demographics | Rating | Rank | Doctorate Degree |
| Immigrants | Portugal | 0.8 /100 | #261 | Tragic 1.5% |
| Chickasaw | 0.7 /100 | #262 | Tragic 1.5% |
| Immigrants | Bahamas | 0.7 /100 | #263 | Tragic 1.5% |
| Blackfeet | 0.7 /100 | #264 | Tragic 1.5% |
| Nicaraguans | 0.6 /100 | #265 | Tragic 1.5% |
| Immigrants | Liberia | 0.5 /100 | #266 | Tragic 1.5% |
| Kiowa | 0.5 /100 | #267 | Tragic 1.5% |
| U.S. Virgin Islanders | 0.5 /100 | #268 | Tragic 1.5% |
| Crow | 0.5 /100 | #269 | Tragic 1.5% |
| Salvadorans | 0.5 /100 | #270 | Tragic 1.5% |
| Immigrants | Trinidad and Tobago | 0.5 /100 | #271 | Tragic 1.5% |
| Immigrants | Barbados | 0.4 /100 | #272 | Tragic 1.5% |
| Sioux | 0.4 /100 | #273 | Tragic 1.5% |
| Yaqui | 0.4 /100 | #274 | Tragic 1.5% |
| Aleuts | 0.4 /100 | #275 | Tragic 1.5% |
Demographics Similar to Pennsylvania Germans by Doctorate Degree
In terms of doctorate degree, the demographic groups most similar to Pennsylvania Germans are Guyanese (1.4%, a difference of 0.010%), Mexican American Indian (1.4%, a difference of 0.13%), Immigrants from Dominica (1.4%, a difference of 0.19%), Shoshone (1.4%, a difference of 0.22%), and Cuban (1.4%, a difference of 0.26%).
| Demographics | Rating | Rank | Doctorate Degree |
| Puerto Ricans | 0.1 /100 | #298 | Tragic 1.4% |
| Belizeans | 0.1 /100 | #299 | Tragic 1.4% |
| Immigrants | Guatemala | 0.1 /100 | #300 | Tragic 1.4% |
| Hondurans | 0.1 /100 | #301 | Tragic 1.4% |
| Shoshone | 0.1 /100 | #302 | Tragic 1.4% |
| Immigrants | Dominica | 0.1 /100 | #303 | Tragic 1.4% |
| Mexican American Indians | 0.1 /100 | #304 | Tragic 1.4% |
| Pennsylvania Germans | 0.1 /100 | #305 | Tragic 1.4% |
| Guyanese | 0.1 /100 | #306 | Tragic 1.4% |
| Cubans | 0.1 /100 | #307 | Tragic 1.4% |
| Immigrants | Laos | 0.1 /100 | #308 | Tragic 1.4% |
| Immigrants | Grenada | 0.1 /100 | #309 | Tragic 1.4% |
| Immigrants | Jamaica | 0.1 /100 | #310 | Tragic 1.4% |
| Immigrants | Honduras | 0.1 /100 | #311 | Tragic 1.4% |
| Immigrants | Nicaragua | 0.1 /100 | #312 | Tragic 1.4% |