Ukrainian vs Immigrants from Uzbekistan GED/Equivalency
COMPARE
Ukrainian
Immigrants from Uzbekistan
GED/Equivalency
GED/Equivalency Comparison
Ukrainians
Immigrants from Uzbekistan
87.7%
GED/EQUIVALENCY
98.8/ 100
METRIC RATING
70th/ 347
METRIC RANK
84.6%
GED/EQUIVALENCY
7.1/ 100
METRIC RATING
223rd/ 347
METRIC RANK
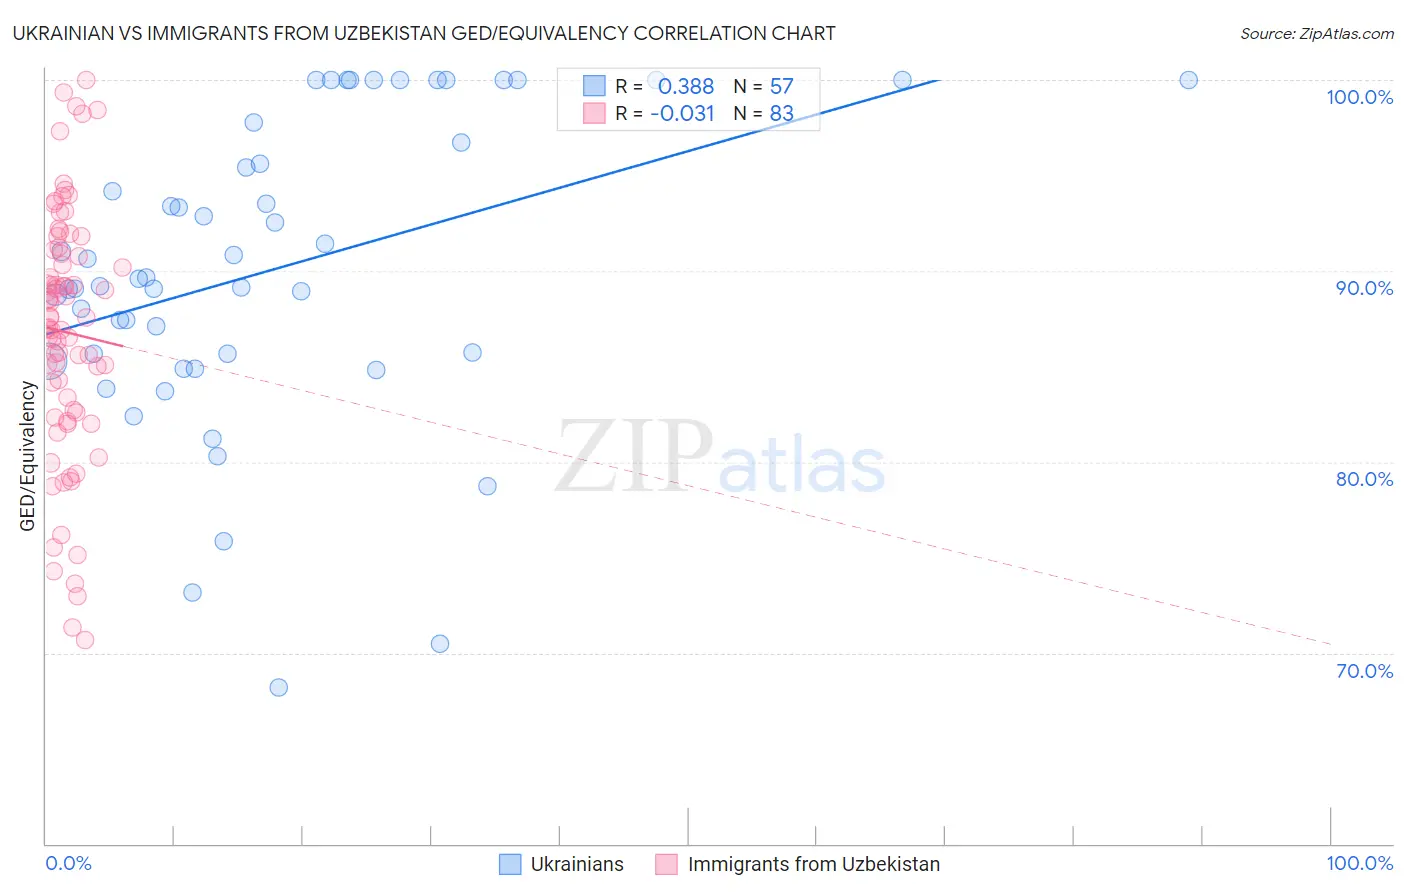
Ukrainian vs Immigrants from Uzbekistan GED/Equivalency Correlation Chart
The statistical analysis conducted on geographies consisting of 448,698,772 people shows a mild positive correlation between the proportion of Ukrainians and percentage of population with at least ged/equivalency education in the United States with a correlation coefficient (R) of 0.388 and weighted average of 87.7%. Similarly, the statistical analysis conducted on geographies consisting of 118,765,305 people shows no correlation between the proportion of Immigrants from Uzbekistan and percentage of population with at least ged/equivalency education in the United States with a correlation coefficient (R) of -0.031 and weighted average of 84.6%, a difference of 3.6%.
GED/Equivalency Correlation Summary
| Measurement | Ukrainian | Immigrants from Uzbekistan |
| Minimum | 68.2% | 70.7% |
| Maximum | 100.0% | 100.0% |
| Range | 31.8% | 29.3% |
| Mean | 90.1% | 86.8% |
| Median | 89.6% | 87.6% |
| Interquartile 25% (IQ1) | 85.5% | 82.6% |
| Interquartile 75% (IQ3) | 97.3% | 91.1% |
| Interquartile Range (IQR) | 11.8% | 8.5% |
| Standard Deviation (Sample) | 7.9% | 6.6% |
| Standard Deviation (Population) | 7.8% | 6.5% |
Similar Demographics by GED/Equivalency
Demographics Similar to Ukrainians by GED/Equivalency
In terms of ged/equivalency, the demographic groups most similar to Ukrainians are Austrian (87.7%, a difference of 0.0%), Immigrants from Moldova (87.7%, a difference of 0.0%), Belgian (87.7%, a difference of 0.010%), Immigrants from Kuwait (87.7%, a difference of 0.030%), and Immigrants from Saudi Arabia (87.8%, a difference of 0.050%).
| Demographics | Rating | Rank | GED/Equivalency |
| Immigrants | Turkey | 99.2 /100 | #63 | Exceptional 87.9% |
| Immigrants | Canada | 99.2 /100 | #64 | Exceptional 87.9% |
| Immigrants | North America | 99.1 /100 | #65 | Exceptional 87.8% |
| Immigrants | Bulgaria | 99.1 /100 | #66 | Exceptional 87.8% |
| British | 99.1 /100 | #67 | Exceptional 87.8% |
| Immigrants | France | 99.1 /100 | #68 | Exceptional 87.8% |
| Immigrants | Saudi Arabia | 99.0 /100 | #69 | Exceptional 87.8% |
| Ukrainians | 98.8 /100 | #70 | Exceptional 87.7% |
| Austrians | 98.8 /100 | #71 | Exceptional 87.7% |
| Immigrants | Moldova | 98.8 /100 | #72 | Exceptional 87.7% |
| Belgians | 98.8 /100 | #73 | Exceptional 87.7% |
| Immigrants | Kuwait | 98.8 /100 | #74 | Exceptional 87.7% |
| Scottish | 98.7 /100 | #75 | Exceptional 87.7% |
| Immigrants | Serbia | 98.7 /100 | #76 | Exceptional 87.7% |
| Slavs | 98.7 /100 | #77 | Exceptional 87.7% |
Demographics Similar to Immigrants from Uzbekistan by GED/Equivalency
In terms of ged/equivalency, the demographic groups most similar to Immigrants from Uzbekistan are Iroquois (84.6%, a difference of 0.030%), Taiwanese (84.7%, a difference of 0.070%), French American Indian (84.6%, a difference of 0.070%), Potawatomi (84.7%, a difference of 0.080%), and American (84.7%, a difference of 0.080%).
| Demographics | Rating | Rank | GED/Equivalency |
| Immigrants | Micronesia | 8.7 /100 | #216 | Tragic 84.7% |
| Nigerians | 8.6 /100 | #217 | Tragic 84.7% |
| Alaska Natives | 8.6 /100 | #218 | Tragic 84.7% |
| Potawatomi | 8.2 /100 | #219 | Tragic 84.7% |
| Americans | 8.2 /100 | #220 | Tragic 84.7% |
| Taiwanese | 8.1 /100 | #221 | Tragic 84.7% |
| Iroquois | 7.5 /100 | #222 | Tragic 84.6% |
| Immigrants | Uzbekistan | 7.1 /100 | #223 | Tragic 84.6% |
| French American Indians | 6.3 /100 | #224 | Tragic 84.6% |
| Immigrants | Thailand | 5.8 /100 | #225 | Tragic 84.5% |
| Immigrants | Zaire | 5.5 /100 | #226 | Tragic 84.5% |
| Immigrants | Costa Rica | 5.4 /100 | #227 | Tragic 84.5% |
| Immigrants | Liberia | 4.9 /100 | #228 | Tragic 84.4% |
| Immigrants | Uruguay | 4.6 /100 | #229 | Tragic 84.4% |
| Immigrants | Colombia | 4.5 /100 | #230 | Tragic 84.4% |