Immigrants from Eritrea vs Immigrants from Uzbekistan GED/Equivalency
COMPARE
Immigrants from Eritrea
Immigrants from Uzbekistan
GED/Equivalency
GED/Equivalency Comparison
Immigrants from Eritrea
Immigrants from Uzbekistan
84.3%
GED/EQUIVALENCY
3.5/ 100
METRIC RATING
236th/ 347
METRIC RANK
84.6%
GED/EQUIVALENCY
7.1/ 100
METRIC RATING
223rd/ 347
METRIC RANK
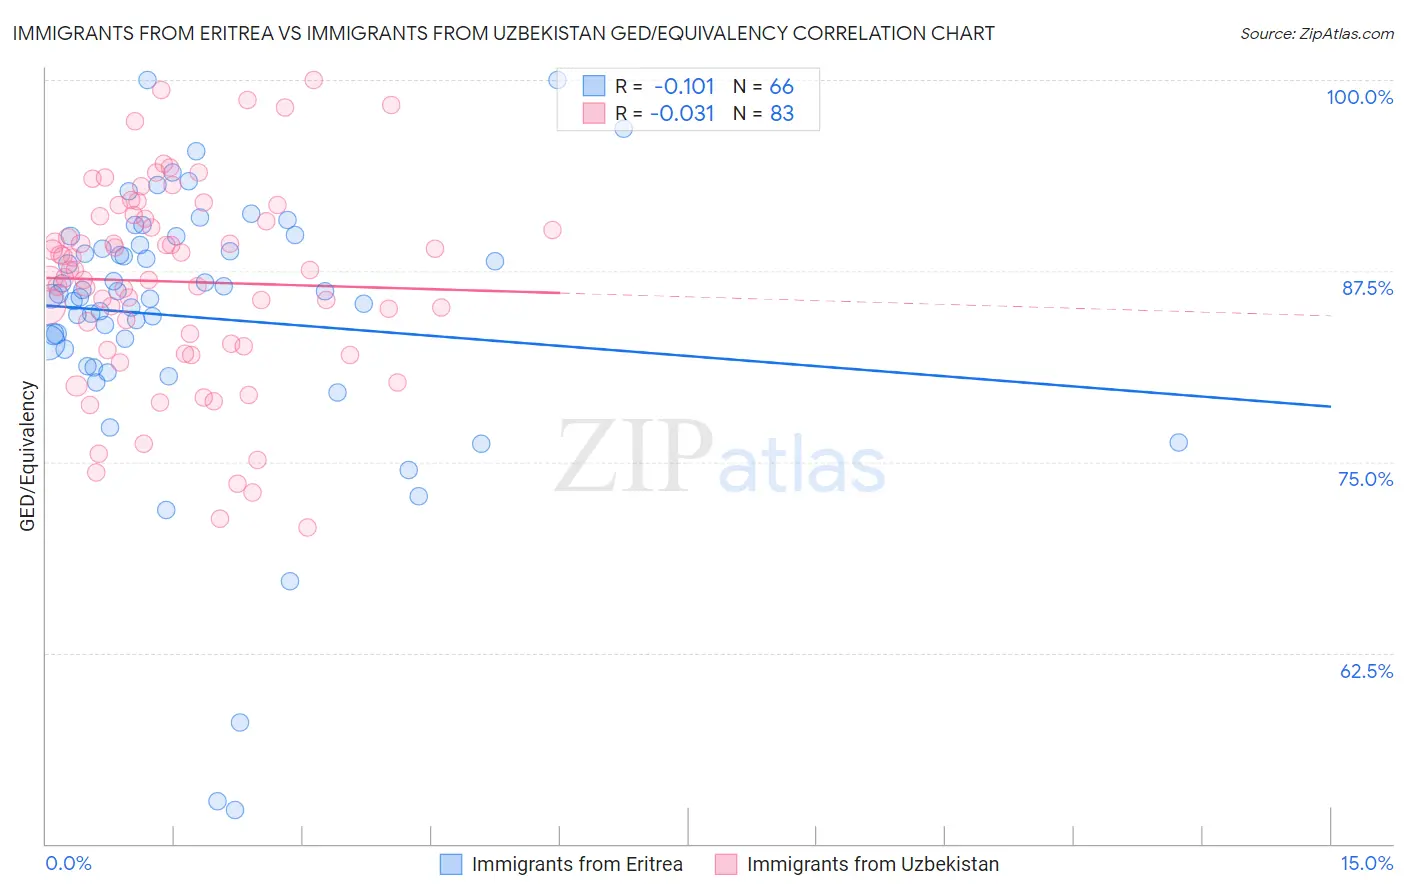
Immigrants from Eritrea vs Immigrants from Uzbekistan GED/Equivalency Correlation Chart
The statistical analysis conducted on geographies consisting of 104,852,788 people shows a poor negative correlation between the proportion of Immigrants from Eritrea and percentage of population with at least ged/equivalency education in the United States with a correlation coefficient (R) of -0.101 and weighted average of 84.3%. Similarly, the statistical analysis conducted on geographies consisting of 118,765,305 people shows no correlation between the proportion of Immigrants from Uzbekistan and percentage of population with at least ged/equivalency education in the United States with a correlation coefficient (R) of -0.031 and weighted average of 84.6%, a difference of 0.40%.
GED/Equivalency Correlation Summary
| Measurement | Immigrants from Eritrea | Immigrants from Uzbekistan |
| Minimum | 52.2% | 70.7% |
| Maximum | 100.0% | 100.0% |
| Range | 47.8% | 29.3% |
| Mean | 84.5% | 86.8% |
| Median | 85.9% | 87.6% |
| Interquartile 25% (IQ1) | 82.4% | 82.6% |
| Interquartile 75% (IQ3) | 89.2% | 91.1% |
| Interquartile Range (IQR) | 6.8% | 8.5% |
| Standard Deviation (Sample) | 9.0% | 6.6% |
| Standard Deviation (Population) | 8.9% | 6.5% |
Demographics Similar to Immigrants from Eritrea and Immigrants from Uzbekistan by GED/Equivalency
In terms of ged/equivalency, the demographic groups most similar to Immigrants from Eritrea are Ghanaian (84.3%, a difference of 0.0%), Immigrants from Nigeria (84.3%, a difference of 0.020%), Subsaharan African (84.2%, a difference of 0.070%), Immigrants from South America (84.4%, a difference of 0.10%), and Immigrants from Panama (84.4%, a difference of 0.10%). Similarly, the demographic groups most similar to Immigrants from Uzbekistan are Iroquois (84.6%, a difference of 0.030%), Taiwanese (84.7%, a difference of 0.070%), French American Indian (84.6%, a difference of 0.070%), Potawatomi (84.7%, a difference of 0.080%), and American (84.7%, a difference of 0.080%).
| Demographics | Rating | Rank | GED/Equivalency |
| Potawatomi | 8.2 /100 | #219 | Tragic 84.7% |
| Americans | 8.2 /100 | #220 | Tragic 84.7% |
| Taiwanese | 8.1 /100 | #221 | Tragic 84.7% |
| Iroquois | 7.5 /100 | #222 | Tragic 84.6% |
| Immigrants | Uzbekistan | 7.1 /100 | #223 | Tragic 84.6% |
| French American Indians | 6.3 /100 | #224 | Tragic 84.6% |
| Immigrants | Thailand | 5.8 /100 | #225 | Tragic 84.5% |
| Immigrants | Zaire | 5.5 /100 | #226 | Tragic 84.5% |
| Immigrants | Costa Rica | 5.4 /100 | #227 | Tragic 84.5% |
| Immigrants | Liberia | 4.9 /100 | #228 | Tragic 84.4% |
| Immigrants | Uruguay | 4.6 /100 | #229 | Tragic 84.4% |
| Immigrants | Colombia | 4.5 /100 | #230 | Tragic 84.4% |
| Immigrants | Middle Africa | 4.3 /100 | #231 | Tragic 84.4% |
| Immigrants | South America | 4.2 /100 | #232 | Tragic 84.4% |
| Immigrants | Panama | 4.1 /100 | #233 | Tragic 84.4% |
| Immigrants | Nigeria | 3.6 /100 | #234 | Tragic 84.3% |
| Ghanaians | 3.5 /100 | #235 | Tragic 84.3% |
| Immigrants | Eritrea | 3.5 /100 | #236 | Tragic 84.3% |
| Sub-Saharan Africans | 3.0 /100 | #237 | Tragic 84.2% |
| Immigrants | Peru | 2.7 /100 | #238 | Tragic 84.2% |
| Immigrants | Bahamas | 2.6 /100 | #239 | Tragic 84.2% |