Ukrainian vs Immigrants from North Macedonia GED/Equivalency
COMPARE
Ukrainian
Immigrants from North Macedonia
GED/Equivalency
GED/Equivalency Comparison
Ukrainians
Immigrants from North Macedonia
87.7%
GED/EQUIVALENCY
98.8/ 100
METRIC RATING
70th/ 347
METRIC RANK
87.4%
GED/EQUIVALENCY
97.8/ 100
METRIC RATING
93rd/ 347
METRIC RANK
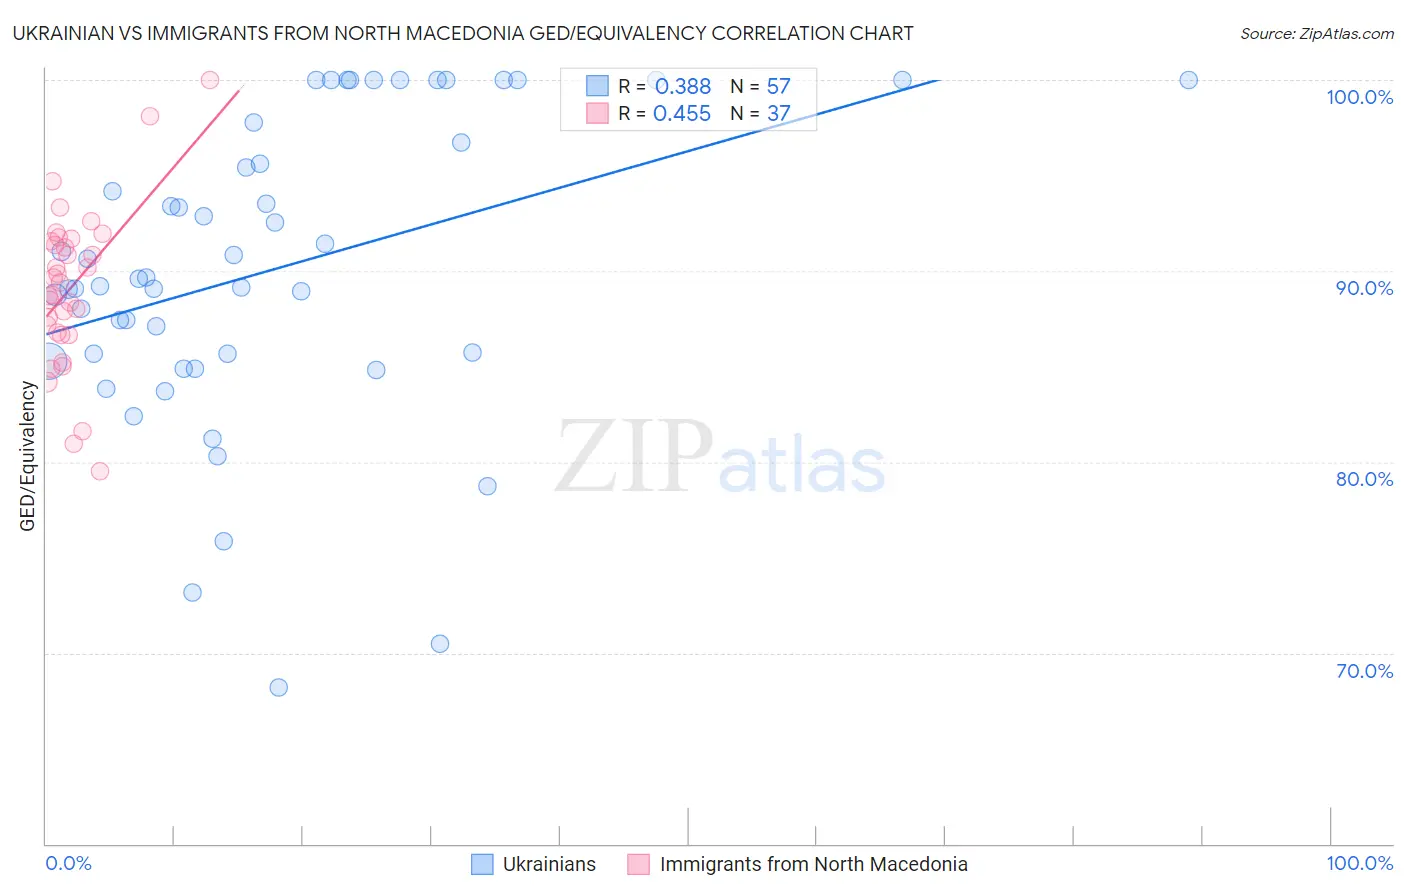
Ukrainian vs Immigrants from North Macedonia GED/Equivalency Correlation Chart
The statistical analysis conducted on geographies consisting of 448,698,772 people shows a mild positive correlation between the proportion of Ukrainians and percentage of population with at least ged/equivalency education in the United States with a correlation coefficient (R) of 0.388 and weighted average of 87.7%. Similarly, the statistical analysis conducted on geographies consisting of 74,300,344 people shows a moderate positive correlation between the proportion of Immigrants from North Macedonia and percentage of population with at least ged/equivalency education in the United States with a correlation coefficient (R) of 0.455 and weighted average of 87.4%, a difference of 0.33%.
GED/Equivalency Correlation Summary
| Measurement | Ukrainian | Immigrants from North Macedonia |
| Minimum | 68.2% | 79.5% |
| Maximum | 100.0% | 100.0% |
| Range | 31.8% | 20.5% |
| Mean | 90.1% | 89.1% |
| Median | 89.6% | 89.4% |
| Interquartile 25% (IQ1) | 85.5% | 86.7% |
| Interquartile 75% (IQ3) | 97.3% | 91.6% |
| Interquartile Range (IQR) | 11.8% | 4.9% |
| Standard Deviation (Sample) | 7.9% | 4.2% |
| Standard Deviation (Population) | 7.8% | 4.1% |
Similar Demographics by GED/Equivalency
Demographics Similar to Ukrainians by GED/Equivalency
In terms of ged/equivalency, the demographic groups most similar to Ukrainians are Austrian (87.7%, a difference of 0.0%), Immigrants from Moldova (87.7%, a difference of 0.0%), Belgian (87.7%, a difference of 0.010%), Immigrants from Kuwait (87.7%, a difference of 0.030%), and Immigrants from Saudi Arabia (87.8%, a difference of 0.050%).
| Demographics | Rating | Rank | GED/Equivalency |
| Immigrants | Turkey | 99.2 /100 | #63 | Exceptional 87.9% |
| Immigrants | Canada | 99.2 /100 | #64 | Exceptional 87.9% |
| Immigrants | North America | 99.1 /100 | #65 | Exceptional 87.8% |
| Immigrants | Bulgaria | 99.1 /100 | #66 | Exceptional 87.8% |
| British | 99.1 /100 | #67 | Exceptional 87.8% |
| Immigrants | France | 99.1 /100 | #68 | Exceptional 87.8% |
| Immigrants | Saudi Arabia | 99.0 /100 | #69 | Exceptional 87.8% |
| Ukrainians | 98.8 /100 | #70 | Exceptional 87.7% |
| Austrians | 98.8 /100 | #71 | Exceptional 87.7% |
| Immigrants | Moldova | 98.8 /100 | #72 | Exceptional 87.7% |
| Belgians | 98.8 /100 | #73 | Exceptional 87.7% |
| Immigrants | Kuwait | 98.8 /100 | #74 | Exceptional 87.7% |
| Scottish | 98.7 /100 | #75 | Exceptional 87.7% |
| Immigrants | Serbia | 98.7 /100 | #76 | Exceptional 87.7% |
| Slavs | 98.7 /100 | #77 | Exceptional 87.7% |
Demographics Similar to Immigrants from North Macedonia by GED/Equivalency
In terms of ged/equivalency, the demographic groups most similar to Immigrants from North Macedonia are Immigrants from Russia (87.4%, a difference of 0.0%), Israeli (87.4%, a difference of 0.010%), Immigrants from Eastern Asia (87.4%, a difference of 0.020%), Immigrants from Greece (87.4%, a difference of 0.020%), and Hungarian (87.4%, a difference of 0.030%).
| Demographics | Rating | Rank | GED/Equivalency |
| Immigrants | Europe | 98.1 /100 | #86 | Exceptional 87.5% |
| Native Hawaiians | 98.1 /100 | #87 | Exceptional 87.5% |
| Immigrants | Norway | 98.1 /100 | #88 | Exceptional 87.5% |
| Hungarians | 97.9 /100 | #89 | Exceptional 87.4% |
| Welsh | 97.9 /100 | #90 | Exceptional 87.4% |
| Immigrants | Eastern Asia | 97.9 /100 | #91 | Exceptional 87.4% |
| Israelis | 97.8 /100 | #92 | Exceptional 87.4% |
| Immigrants | North Macedonia | 97.8 /100 | #93 | Exceptional 87.4% |
| Immigrants | Russia | 97.8 /100 | #94 | Exceptional 87.4% |
| Immigrants | Greece | 97.7 /100 | #95 | Exceptional 87.4% |
| Czechoslovakians | 97.6 /100 | #96 | Exceptional 87.4% |
| Immigrants | Western Europe | 97.3 /100 | #97 | Exceptional 87.3% |
| Immigrants | Croatia | 96.9 /100 | #98 | Exceptional 87.3% |
| Immigrants | Belarus | 96.9 /100 | #99 | Exceptional 87.3% |
| Palestinians | 96.8 /100 | #100 | Exceptional 87.3% |