Ukrainian vs Paiute GED/Equivalency
COMPARE
Ukrainian
Paiute
GED/Equivalency
GED/Equivalency Comparison
Ukrainians
Paiute
87.7%
GED/EQUIVALENCY
98.8/ 100
METRIC RATING
70th/ 347
METRIC RANK
82.0%
GED/EQUIVALENCY
0.0/ 100
METRIC RATING
292nd/ 347
METRIC RANK
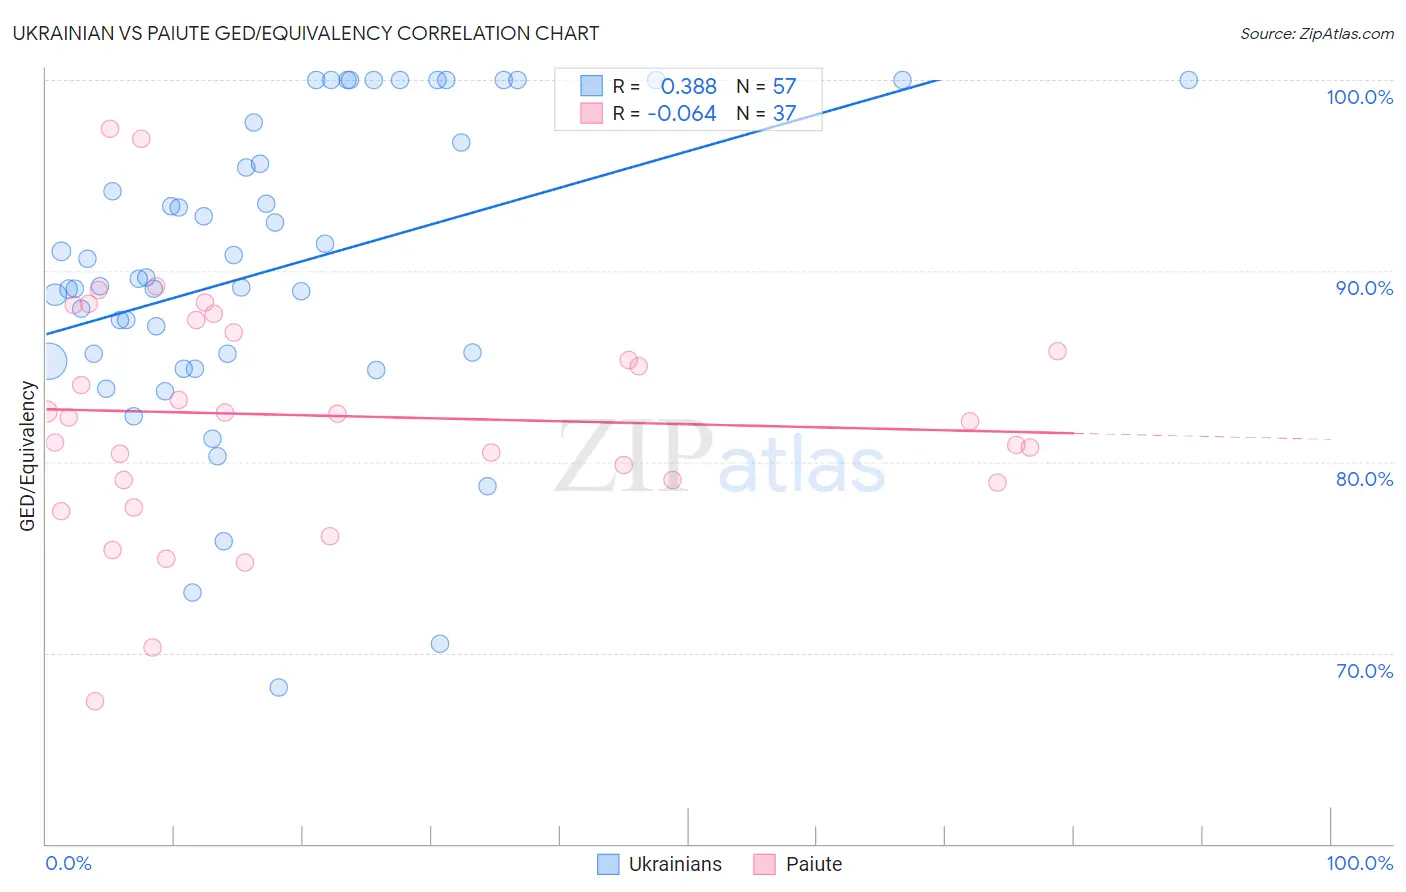
Ukrainian vs Paiute GED/Equivalency Correlation Chart
The statistical analysis conducted on geographies consisting of 448,698,772 people shows a mild positive correlation between the proportion of Ukrainians and percentage of population with at least ged/equivalency education in the United States with a correlation coefficient (R) of 0.388 and weighted average of 87.7%. Similarly, the statistical analysis conducted on geographies consisting of 58,404,221 people shows a slight negative correlation between the proportion of Paiute and percentage of population with at least ged/equivalency education in the United States with a correlation coefficient (R) of -0.064 and weighted average of 82.0%, a difference of 7.0%.
GED/Equivalency Correlation Summary
| Measurement | Ukrainian | Paiute |
| Minimum | 68.2% | 67.5% |
| Maximum | 100.0% | 97.4% |
| Range | 31.8% | 29.9% |
| Mean | 90.1% | 82.4% |
| Median | 89.6% | 82.3% |
| Interquartile 25% (IQ1) | 85.5% | 79.0% |
| Interquartile 75% (IQ3) | 97.3% | 87.1% |
| Interquartile Range (IQR) | 11.8% | 8.1% |
| Standard Deviation (Sample) | 7.9% | 6.3% |
| Standard Deviation (Population) | 7.8% | 6.2% |
Similar Demographics by GED/Equivalency
Demographics Similar to Ukrainians by GED/Equivalency
In terms of ged/equivalency, the demographic groups most similar to Ukrainians are Austrian (87.7%, a difference of 0.0%), Immigrants from Moldova (87.7%, a difference of 0.0%), Belgian (87.7%, a difference of 0.010%), Immigrants from Kuwait (87.7%, a difference of 0.030%), and Immigrants from Saudi Arabia (87.8%, a difference of 0.050%).
| Demographics | Rating | Rank | GED/Equivalency |
| Immigrants | Turkey | 99.2 /100 | #63 | Exceptional 87.9% |
| Immigrants | Canada | 99.2 /100 | #64 | Exceptional 87.9% |
| Immigrants | North America | 99.1 /100 | #65 | Exceptional 87.8% |
| Immigrants | Bulgaria | 99.1 /100 | #66 | Exceptional 87.8% |
| British | 99.1 /100 | #67 | Exceptional 87.8% |
| Immigrants | France | 99.1 /100 | #68 | Exceptional 87.8% |
| Immigrants | Saudi Arabia | 99.0 /100 | #69 | Exceptional 87.8% |
| Ukrainians | 98.8 /100 | #70 | Exceptional 87.7% |
| Austrians | 98.8 /100 | #71 | Exceptional 87.7% |
| Immigrants | Moldova | 98.8 /100 | #72 | Exceptional 87.7% |
| Belgians | 98.8 /100 | #73 | Exceptional 87.7% |
| Immigrants | Kuwait | 98.8 /100 | #74 | Exceptional 87.7% |
| Scottish | 98.7 /100 | #75 | Exceptional 87.7% |
| Immigrants | Serbia | 98.7 /100 | #76 | Exceptional 87.7% |
| Slavs | 98.7 /100 | #77 | Exceptional 87.7% |
Demographics Similar to Paiute by GED/Equivalency
In terms of ged/equivalency, the demographic groups most similar to Paiute are British West Indian (82.0%, a difference of 0.010%), Immigrants from St. Vincent and the Grenadines (82.0%, a difference of 0.030%), Cuban (82.0%, a difference of 0.040%), Haitian (82.1%, a difference of 0.060%), and Nepalese (81.9%, a difference of 0.090%).
| Demographics | Rating | Rank | GED/Equivalency |
| Cajuns | 0.0 /100 | #285 | Tragic 82.4% |
| Immigrants | West Indies | 0.0 /100 | #286 | Tragic 82.4% |
| Japanese | 0.0 /100 | #287 | Tragic 82.4% |
| Pueblo | 0.0 /100 | #288 | Tragic 82.3% |
| Immigrants | Cambodia | 0.0 /100 | #289 | Tragic 82.2% |
| Haitians | 0.0 /100 | #290 | Tragic 82.1% |
| Cubans | 0.0 /100 | #291 | Tragic 82.0% |
| Paiute | 0.0 /100 | #292 | Tragic 82.0% |
| British West Indians | 0.0 /100 | #293 | Tragic 82.0% |
| Immigrants | St. Vincent and the Grenadines | 0.0 /100 | #294 | Tragic 82.0% |
| Nepalese | 0.0 /100 | #295 | Tragic 81.9% |
| Vietnamese | 0.0 /100 | #296 | Tragic 81.9% |
| Immigrants | Bangladesh | 0.0 /100 | #297 | Tragic 81.9% |
| Ute | 0.0 /100 | #298 | Tragic 81.8% |
| Ecuadorians | 0.0 /100 | #299 | Tragic 81.7% |