Ugandan vs Immigrants from Belgium College, 1 year or more
COMPARE
Ugandan
Immigrants from Belgium
College, 1 year or more
College, 1 year or more Comparison
Ugandans
Immigrants from Belgium
61.2%
COLLEGE, 1 YEAR OR MORE
90.7/ 100
METRIC RATING
129th/ 347
METRIC RANK
66.3%
COLLEGE, 1 YEAR OR MORE
100.0/ 100
METRIC RATING
24th/ 347
METRIC RANK
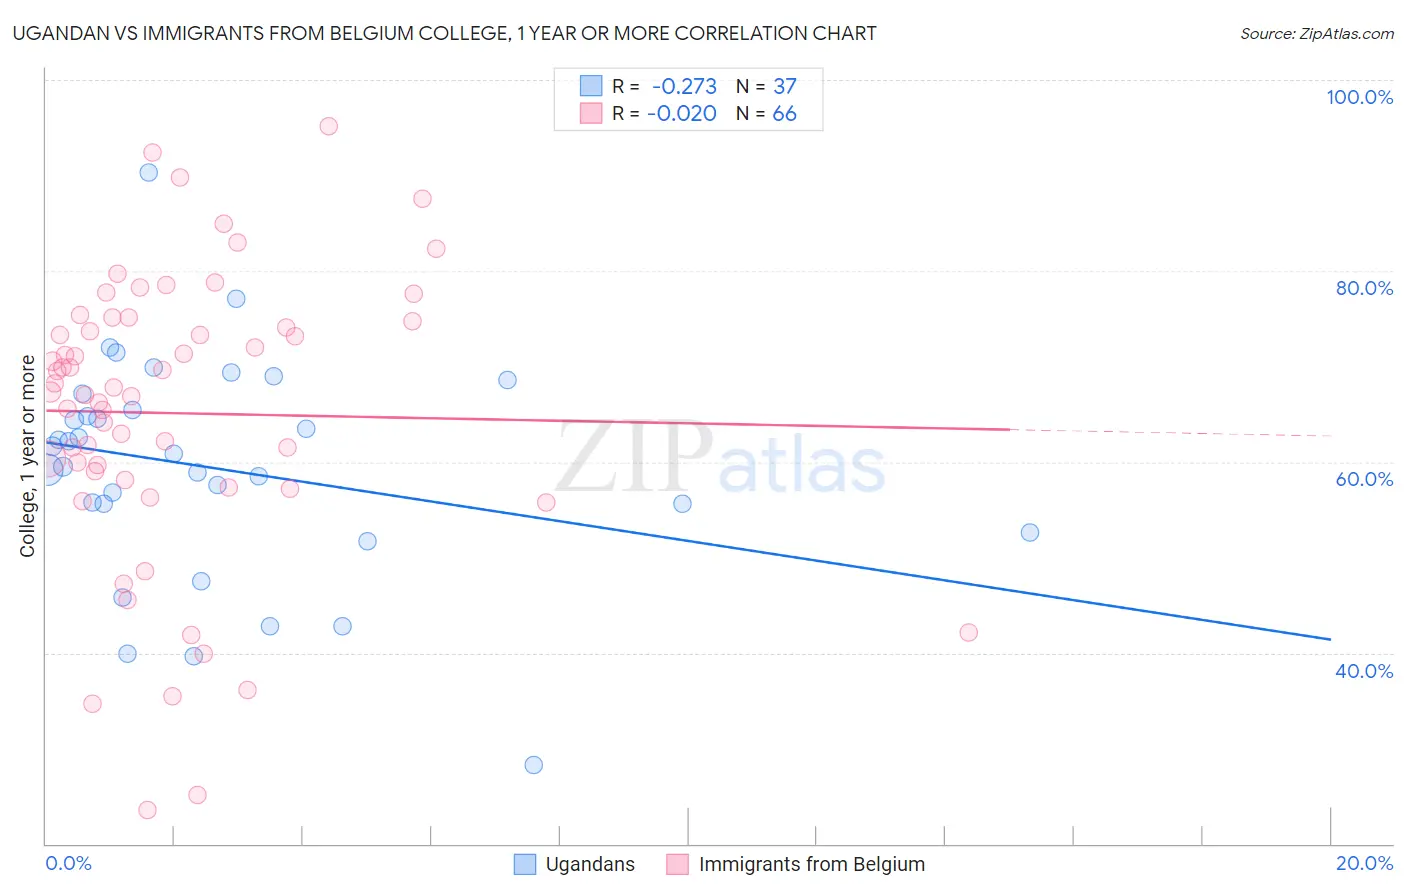
Ugandan vs Immigrants from Belgium College, 1 year or more Correlation Chart
The statistical analysis conducted on geographies consisting of 94,018,576 people shows a weak negative correlation between the proportion of Ugandans and percentage of population with at least college, 1 year or more education in the United States with a correlation coefficient (R) of -0.273 and weighted average of 61.2%. Similarly, the statistical analysis conducted on geographies consisting of 146,729,232 people shows no correlation between the proportion of Immigrants from Belgium and percentage of population with at least college, 1 year or more education in the United States with a correlation coefficient (R) of -0.020 and weighted average of 66.3%, a difference of 8.4%.
College, 1 year or more Correlation Summary
| Measurement | Ugandan | Immigrants from Belgium |
| Minimum | 28.3% | 23.6% |
| Maximum | 90.3% | 95.1% |
| Range | 62.0% | 71.6% |
| Mean | 59.3% | 65.1% |
| Median | 60.9% | 67.6% |
| Interquartile 25% (IQ1) | 54.1% | 58.2% |
| Interquartile 75% (IQ3) | 66.3% | 74.7% |
| Interquartile Range (IQR) | 12.2% | 16.5% |
| Standard Deviation (Sample) | 11.7% | 15.3% |
| Standard Deviation (Population) | 11.6% | 15.1% |
Similar Demographics by College, 1 year or more
Demographics Similar to Ugandans by College, 1 year or more
In terms of college, 1 year or more, the demographic groups most similar to Ugandans are Immigrants from Italy (61.2%, a difference of 0.060%), Immigrants from Eastern Africa (61.2%, a difference of 0.070%), Alsatian (61.3%, a difference of 0.090%), Immigrants from Syria (61.3%, a difference of 0.14%), and Italian (61.1%, a difference of 0.18%).
| Demographics | Rating | Rank | College, 1 year or more |
| Immigrants | Chile | 92.3 /100 | #122 | Exceptional 61.4% |
| Serbians | 92.2 /100 | #123 | Exceptional 61.4% |
| Venezuelans | 92.1 /100 | #124 | Exceptional 61.3% |
| Immigrants | Syria | 91.6 /100 | #125 | Exceptional 61.3% |
| Alsatians | 91.3 /100 | #126 | Exceptional 61.3% |
| Immigrants | Eastern Africa | 91.1 /100 | #127 | Exceptional 61.2% |
| Immigrants | Italy | 91.1 /100 | #128 | Exceptional 61.2% |
| Ugandans | 90.7 /100 | #129 | Exceptional 61.2% |
| Italians | 89.5 /100 | #130 | Excellent 61.1% |
| Immigrants | Morocco | 89.5 /100 | #131 | Excellent 61.1% |
| Scandinavians | 88.2 /100 | #132 | Excellent 61.0% |
| Immigrants | Uzbekistan | 88.0 /100 | #133 | Excellent 61.0% |
| Immigrants | Venezuela | 87.9 /100 | #134 | Excellent 61.0% |
| Immigrants | Uganda | 87.4 /100 | #135 | Excellent 60.9% |
| Basques | 87.2 /100 | #136 | Excellent 60.9% |
Demographics Similar to Immigrants from Belgium by College, 1 year or more
In terms of college, 1 year or more, the demographic groups most similar to Immigrants from Belgium are Immigrants from China (66.4%, a difference of 0.080%), Soviet Union (66.4%, a difference of 0.14%), Immigrants from Hong Kong (66.4%, a difference of 0.20%), Immigrants from Korea (66.5%, a difference of 0.27%), and Immigrants from Switzerland (66.5%, a difference of 0.31%).
| Demographics | Rating | Rank | College, 1 year or more |
| Immigrants | Eastern Asia | 100.0 /100 | #17 | Exceptional 66.6% |
| Eastern Europeans | 100.0 /100 | #18 | Exceptional 66.6% |
| Immigrants | Switzerland | 100.0 /100 | #19 | Exceptional 66.5% |
| Immigrants | Korea | 100.0 /100 | #20 | Exceptional 66.5% |
| Immigrants | Hong Kong | 100.0 /100 | #21 | Exceptional 66.4% |
| Soviet Union | 100.0 /100 | #22 | Exceptional 66.4% |
| Immigrants | China | 100.0 /100 | #23 | Exceptional 66.4% |
| Immigrants | Belgium | 100.0 /100 | #24 | Exceptional 66.3% |
| Indians (Asian) | 100.0 /100 | #25 | Exceptional 66.1% |
| Latvians | 100.0 /100 | #26 | Exceptional 66.1% |
| Immigrants | Ireland | 100.0 /100 | #27 | Exceptional 65.9% |
| Immigrants | France | 100.0 /100 | #28 | Exceptional 65.8% |
| Immigrants | Northern Europe | 100.0 /100 | #29 | Exceptional 65.6% |
| Immigrants | Denmark | 100.0 /100 | #30 | Exceptional 65.6% |
| Turks | 100.0 /100 | #31 | Exceptional 65.5% |