Cambodian vs Immigrants from Jordan College, 1 year or more
COMPARE
Cambodian
Immigrants from Jordan
College, 1 year or more
College, 1 year or more Comparison
Cambodians
Immigrants from Jordan
66.7%
COLLEGE, 1 YEAR OR MORE
100.0/ 100
METRIC RATING
15th/ 347
METRIC RANK
61.4%
COLLEGE, 1 YEAR OR MORE
92.7/ 100
METRIC RATING
121st/ 347
METRIC RANK
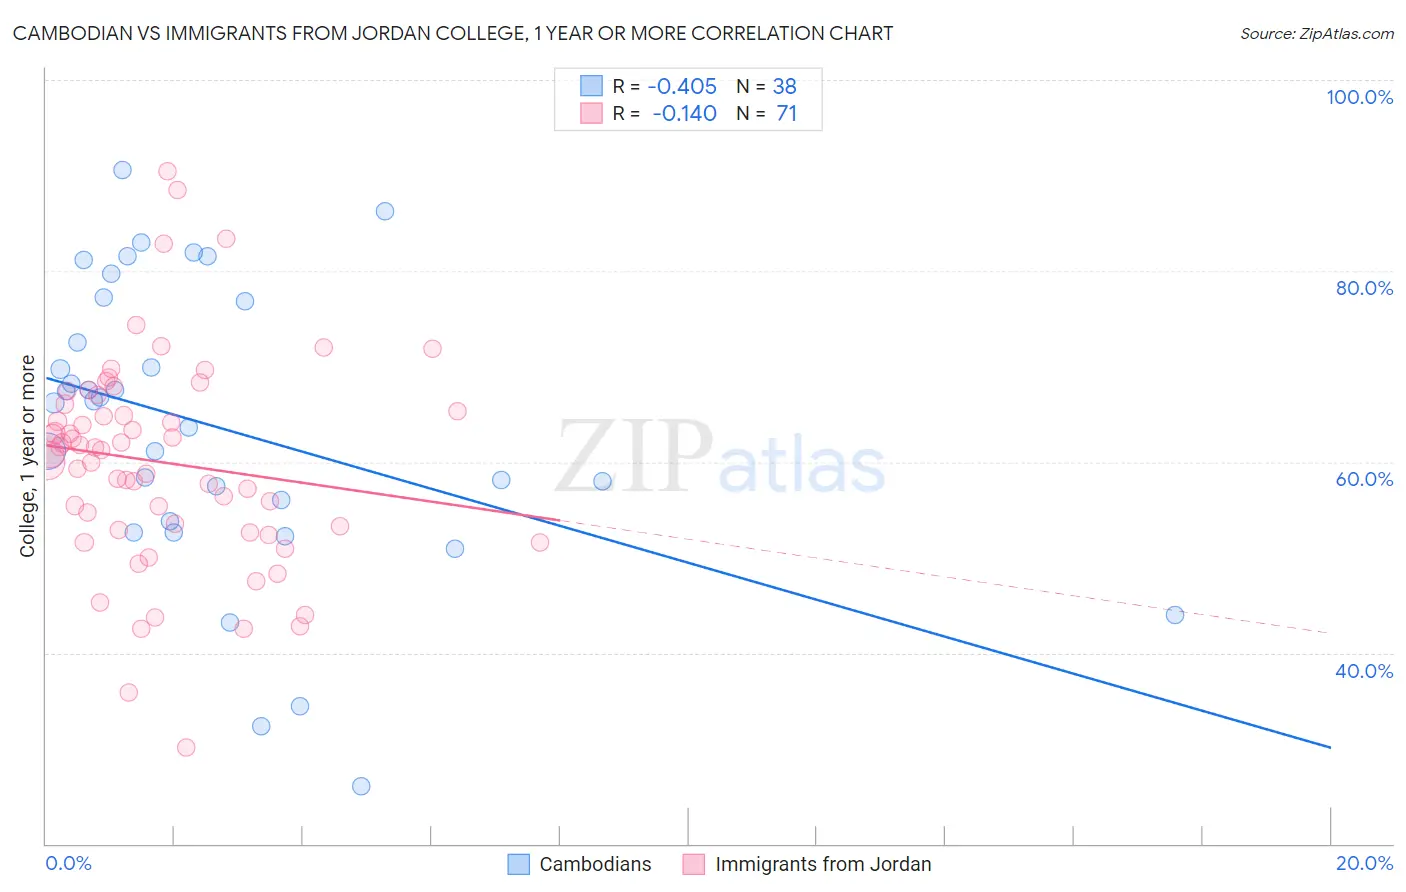
Cambodian vs Immigrants from Jordan College, 1 year or more Correlation Chart
The statistical analysis conducted on geographies consisting of 102,514,976 people shows a moderate negative correlation between the proportion of Cambodians and percentage of population with at least college, 1 year or more education in the United States with a correlation coefficient (R) of -0.405 and weighted average of 66.7%. Similarly, the statistical analysis conducted on geographies consisting of 181,276,954 people shows a poor negative correlation between the proportion of Immigrants from Jordan and percentage of population with at least college, 1 year or more education in the United States with a correlation coefficient (R) of -0.140 and weighted average of 61.4%, a difference of 8.6%.
College, 1 year or more Correlation Summary
| Measurement | Cambodian | Immigrants from Jordan |
| Minimum | 26.0% | 30.1% |
| Maximum | 90.6% | 90.5% |
| Range | 64.6% | 60.3% |
| Mean | 63.6% | 60.0% |
| Median | 66.3% | 61.3% |
| Interquartile 25% (IQ1) | 53.8% | 52.9% |
| Interquartile 75% (IQ3) | 76.8% | 66.0% |
| Interquartile Range (IQR) | 23.0% | 13.2% |
| Standard Deviation (Sample) | 15.3% | 11.0% |
| Standard Deviation (Population) | 15.1% | 11.0% |
Similar Demographics by College, 1 year or more
Demographics Similar to Cambodians by College, 1 year or more
In terms of college, 1 year or more, the demographic groups most similar to Cambodians are Burmese (66.7%, a difference of 0.0%), Immigrants from Japan (66.7%, a difference of 0.030%), Immigrants from Eastern Asia (66.6%, a difference of 0.15%), Immigrants from Sweden (66.8%, a difference of 0.19%), and Eastern European (66.6%, a difference of 0.22%).
| Demographics | Rating | Rank | College, 1 year or more |
| Thais | 100.0 /100 | #8 | Exceptional 68.6% |
| Immigrants | Israel | 100.0 /100 | #9 | Exceptional 67.8% |
| Immigrants | Australia | 100.0 /100 | #10 | Exceptional 67.7% |
| Immigrants | South Central Asia | 100.0 /100 | #11 | Exceptional 67.1% |
| Cypriots | 100.0 /100 | #12 | Exceptional 67.0% |
| Immigrants | Sweden | 100.0 /100 | #13 | Exceptional 66.8% |
| Burmese | 100.0 /100 | #14 | Exceptional 66.7% |
| Cambodians | 100.0 /100 | #15 | Exceptional 66.7% |
| Immigrants | Japan | 100.0 /100 | #16 | Exceptional 66.7% |
| Immigrants | Eastern Asia | 100.0 /100 | #17 | Exceptional 66.6% |
| Eastern Europeans | 100.0 /100 | #18 | Exceptional 66.6% |
| Immigrants | Switzerland | 100.0 /100 | #19 | Exceptional 66.5% |
| Immigrants | Korea | 100.0 /100 | #20 | Exceptional 66.5% |
| Immigrants | Hong Kong | 100.0 /100 | #21 | Exceptional 66.4% |
| Soviet Union | 100.0 /100 | #22 | Exceptional 66.4% |
Demographics Similar to Immigrants from Jordan by College, 1 year or more
In terms of college, 1 year or more, the demographic groups most similar to Immigrants from Jordan are Immigrants from Chile (61.4%, a difference of 0.080%), Pakistani (61.5%, a difference of 0.10%), Serbian (61.4%, a difference of 0.10%), Assyrian/Chaldean/Syriac (61.5%, a difference of 0.11%), and Venezuelan (61.3%, a difference of 0.12%).
| Demographics | Rating | Rank | College, 1 year or more |
| Danes | 94.8 /100 | #114 | Exceptional 61.7% |
| Norwegians | 94.5 /100 | #115 | Exceptional 61.7% |
| Lebanese | 94.1 /100 | #116 | Exceptional 61.6% |
| Arabs | 93.9 /100 | #117 | Exceptional 61.6% |
| Immigrants | Brazil | 93.9 /100 | #118 | Exceptional 61.6% |
| Assyrians/Chaldeans/Syriacs | 93.3 /100 | #119 | Exceptional 61.5% |
| Pakistanis | 93.2 /100 | #120 | Exceptional 61.5% |
| Immigrants | Jordan | 92.7 /100 | #121 | Exceptional 61.4% |
| Immigrants | Chile | 92.3 /100 | #122 | Exceptional 61.4% |
| Serbians | 92.2 /100 | #123 | Exceptional 61.4% |
| Venezuelans | 92.1 /100 | #124 | Exceptional 61.3% |
| Immigrants | Syria | 91.6 /100 | #125 | Exceptional 61.3% |
| Alsatians | 91.3 /100 | #126 | Exceptional 61.3% |
| Immigrants | Eastern Africa | 91.1 /100 | #127 | Exceptional 61.2% |
| Immigrants | Italy | 91.1 /100 | #128 | Exceptional 61.2% |