Immigrants from Pakistan vs Immigrants from Jordan College, 1 year or more
COMPARE
Immigrants from Pakistan
Immigrants from Jordan
College, 1 year or more
College, 1 year or more Comparison
Immigrants from Pakistan
Immigrants from Jordan
62.8%
COLLEGE, 1 YEAR OR MORE
98.6/ 100
METRIC RATING
85th/ 347
METRIC RANK
61.4%
COLLEGE, 1 YEAR OR MORE
92.7/ 100
METRIC RATING
121st/ 347
METRIC RANK
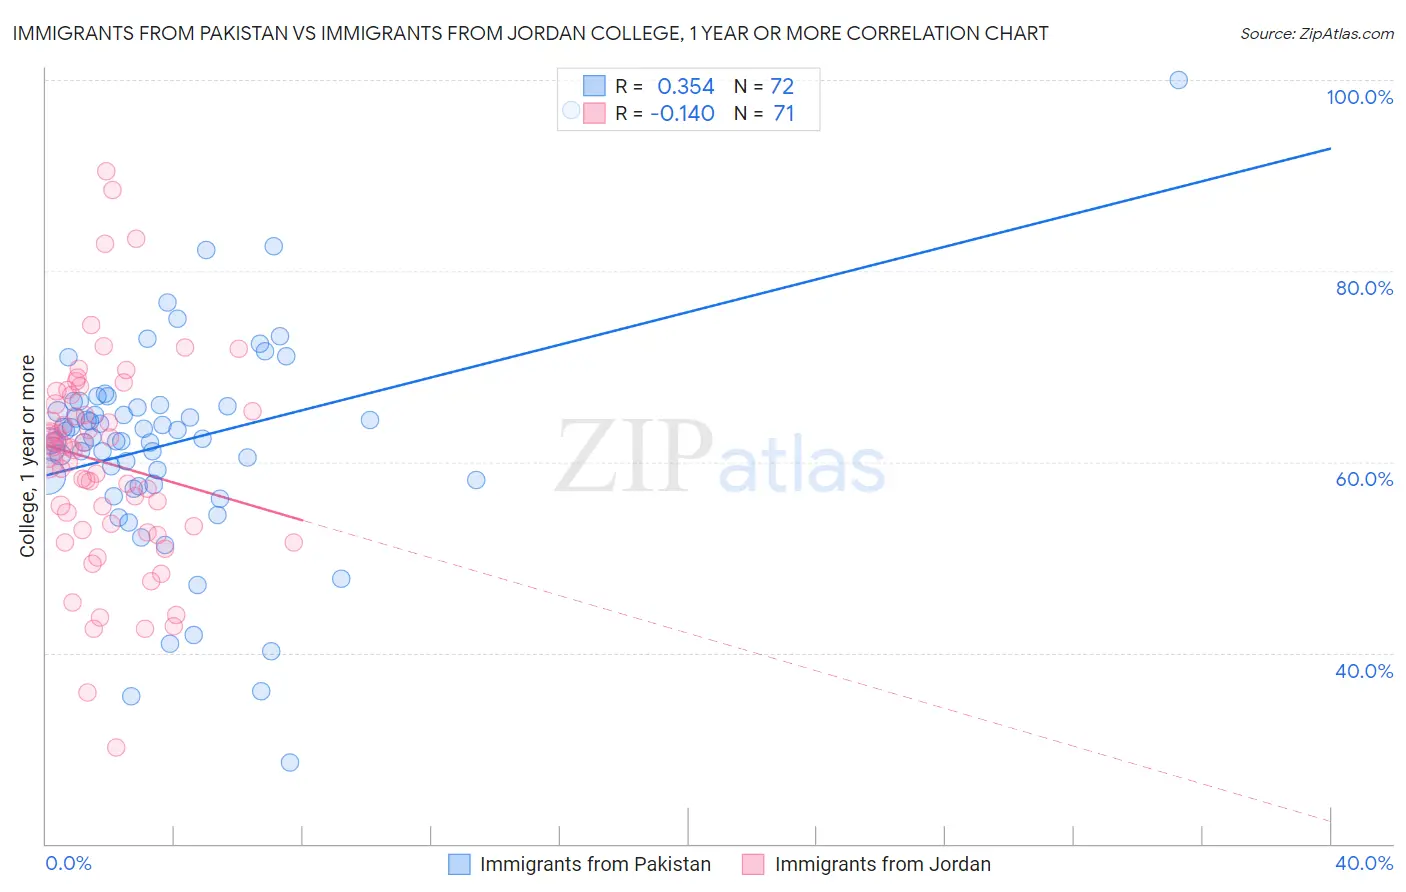
Immigrants from Pakistan vs Immigrants from Jordan College, 1 year or more Correlation Chart
The statistical analysis conducted on geographies consisting of 283,910,237 people shows a mild positive correlation between the proportion of Immigrants from Pakistan and percentage of population with at least college, 1 year or more education in the United States with a correlation coefficient (R) of 0.354 and weighted average of 62.8%. Similarly, the statistical analysis conducted on geographies consisting of 181,276,954 people shows a poor negative correlation between the proportion of Immigrants from Jordan and percentage of population with at least college, 1 year or more education in the United States with a correlation coefficient (R) of -0.140 and weighted average of 61.4%, a difference of 2.2%.
College, 1 year or more Correlation Summary
| Measurement | Immigrants from Pakistan | Immigrants from Jordan |
| Minimum | 28.6% | 30.1% |
| Maximum | 100.0% | 90.5% |
| Range | 71.4% | 60.3% |
| Mean | 62.0% | 60.0% |
| Median | 62.5% | 61.3% |
| Interquartile 25% (IQ1) | 57.9% | 52.9% |
| Interquartile 75% (IQ3) | 65.9% | 66.0% |
| Interquartile Range (IQR) | 8.1% | 13.2% |
| Standard Deviation (Sample) | 11.6% | 11.0% |
| Standard Deviation (Population) | 11.5% | 11.0% |
Similar Demographics by College, 1 year or more
Demographics Similar to Immigrants from Pakistan by College, 1 year or more
In terms of college, 1 year or more, the demographic groups most similar to Immigrants from Pakistan are Immigrants from England (62.8%, a difference of 0.010%), Immigrants from Western Europe (62.7%, a difference of 0.020%), Immigrants from Argentina (62.8%, a difference of 0.040%), Immigrants from Hungary (62.7%, a difference of 0.040%), and Immigrants from Bolivia (62.8%, a difference of 0.080%).
| Demographics | Rating | Rank | College, 1 year or more |
| Immigrants | Lebanon | 98.8 /100 | #78 | Exceptional 62.9% |
| Northern Europeans | 98.8 /100 | #79 | Exceptional 62.9% |
| Lithuanians | 98.8 /100 | #80 | Exceptional 62.9% |
| Laotians | 98.7 /100 | #81 | Exceptional 62.8% |
| Immigrants | Bolivia | 98.7 /100 | #82 | Exceptional 62.8% |
| Immigrants | Argentina | 98.6 /100 | #83 | Exceptional 62.8% |
| Immigrants | England | 98.6 /100 | #84 | Exceptional 62.8% |
| Immigrants | Pakistan | 98.6 /100 | #85 | Exceptional 62.8% |
| Immigrants | Western Europe | 98.6 /100 | #86 | Exceptional 62.7% |
| Immigrants | Hungary | 98.6 /100 | #87 | Exceptional 62.7% |
| Greeks | 98.3 /100 | #88 | Exceptional 62.6% |
| Immigrants | Ethiopia | 98.2 /100 | #89 | Exceptional 62.6% |
| Immigrants | Western Asia | 97.9 /100 | #90 | Exceptional 62.5% |
| Immigrants | Eastern Europe | 97.8 /100 | #91 | Exceptional 62.4% |
| Immigrants | Egypt | 97.8 /100 | #92 | Exceptional 62.4% |
Demographics Similar to Immigrants from Jordan by College, 1 year or more
In terms of college, 1 year or more, the demographic groups most similar to Immigrants from Jordan are Immigrants from Chile (61.4%, a difference of 0.080%), Pakistani (61.5%, a difference of 0.10%), Serbian (61.4%, a difference of 0.10%), Assyrian/Chaldean/Syriac (61.5%, a difference of 0.11%), and Venezuelan (61.3%, a difference of 0.12%).
| Demographics | Rating | Rank | College, 1 year or more |
| Danes | 94.8 /100 | #114 | Exceptional 61.7% |
| Norwegians | 94.5 /100 | #115 | Exceptional 61.7% |
| Lebanese | 94.1 /100 | #116 | Exceptional 61.6% |
| Arabs | 93.9 /100 | #117 | Exceptional 61.6% |
| Immigrants | Brazil | 93.9 /100 | #118 | Exceptional 61.6% |
| Assyrians/Chaldeans/Syriacs | 93.3 /100 | #119 | Exceptional 61.5% |
| Pakistanis | 93.2 /100 | #120 | Exceptional 61.5% |
| Immigrants | Jordan | 92.7 /100 | #121 | Exceptional 61.4% |
| Immigrants | Chile | 92.3 /100 | #122 | Exceptional 61.4% |
| Serbians | 92.2 /100 | #123 | Exceptional 61.4% |
| Venezuelans | 92.1 /100 | #124 | Exceptional 61.3% |
| Immigrants | Syria | 91.6 /100 | #125 | Exceptional 61.3% |
| Alsatians | 91.3 /100 | #126 | Exceptional 61.3% |
| Immigrants | Eastern Africa | 91.1 /100 | #127 | Exceptional 61.2% |
| Immigrants | Italy | 91.1 /100 | #128 | Exceptional 61.2% |