Ugandan vs Finnish College, 1 year or more
COMPARE
Ugandan
Finnish
College, 1 year or more
College, 1 year or more Comparison
Ugandans
Finns
61.2%
COLLEGE, 1 YEAR OR MORE
90.7/ 100
METRIC RATING
129th/ 347
METRIC RANK
60.2%
COLLEGE, 1 YEAR OR MORE
72.9/ 100
METRIC RATING
156th/ 347
METRIC RANK
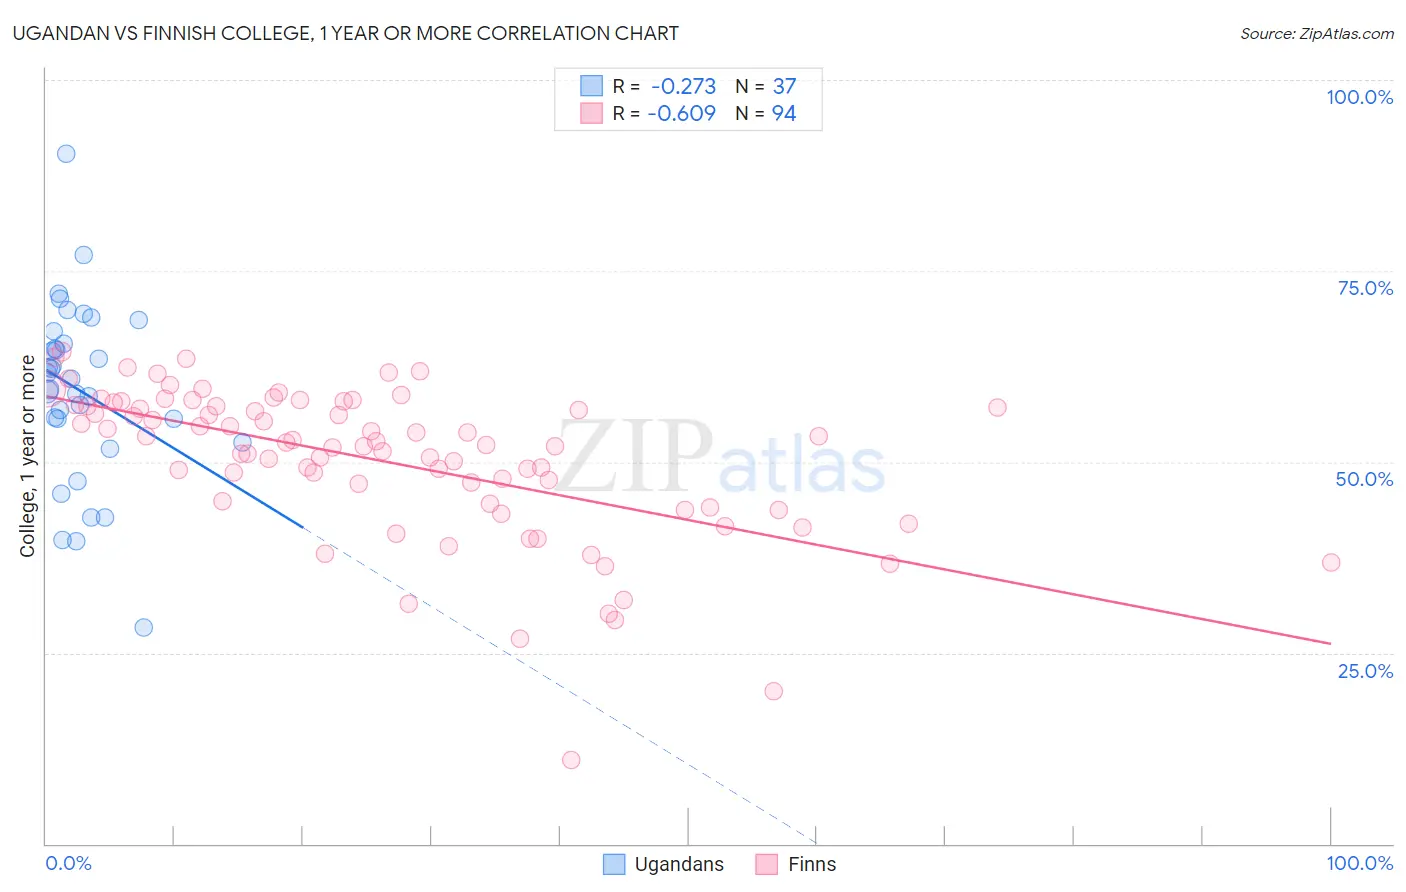
Ugandan vs Finnish College, 1 year or more Correlation Chart
The statistical analysis conducted on geographies consisting of 94,018,576 people shows a weak negative correlation between the proportion of Ugandans and percentage of population with at least college, 1 year or more education in the United States with a correlation coefficient (R) of -0.273 and weighted average of 61.2%. Similarly, the statistical analysis conducted on geographies consisting of 404,673,514 people shows a significant negative correlation between the proportion of Finns and percentage of population with at least college, 1 year or more education in the United States with a correlation coefficient (R) of -0.609 and weighted average of 60.2%, a difference of 1.7%.
College, 1 year or more Correlation Summary
| Measurement | Ugandan | Finnish |
| Minimum | 28.3% | 11.0% |
| Maximum | 90.3% | 64.4% |
| Range | 62.0% | 53.4% |
| Mean | 59.3% | 50.1% |
| Median | 60.9% | 52.3% |
| Interquartile 25% (IQ1) | 54.1% | 44.5% |
| Interquartile 75% (IQ3) | 66.3% | 57.3% |
| Interquartile Range (IQR) | 12.2% | 12.8% |
| Standard Deviation (Sample) | 11.7% | 10.0% |
| Standard Deviation (Population) | 11.6% | 9.9% |
Similar Demographics by College, 1 year or more
Demographics Similar to Ugandans by College, 1 year or more
In terms of college, 1 year or more, the demographic groups most similar to Ugandans are Immigrants from Italy (61.2%, a difference of 0.060%), Immigrants from Eastern Africa (61.2%, a difference of 0.070%), Alsatian (61.3%, a difference of 0.090%), Immigrants from Syria (61.3%, a difference of 0.14%), and Italian (61.1%, a difference of 0.18%).
| Demographics | Rating | Rank | College, 1 year or more |
| Immigrants | Chile | 92.3 /100 | #122 | Exceptional 61.4% |
| Serbians | 92.2 /100 | #123 | Exceptional 61.4% |
| Venezuelans | 92.1 /100 | #124 | Exceptional 61.3% |
| Immigrants | Syria | 91.6 /100 | #125 | Exceptional 61.3% |
| Alsatians | 91.3 /100 | #126 | Exceptional 61.3% |
| Immigrants | Eastern Africa | 91.1 /100 | #127 | Exceptional 61.2% |
| Immigrants | Italy | 91.1 /100 | #128 | Exceptional 61.2% |
| Ugandans | 90.7 /100 | #129 | Exceptional 61.2% |
| Italians | 89.5 /100 | #130 | Excellent 61.1% |
| Immigrants | Morocco | 89.5 /100 | #131 | Excellent 61.1% |
| Scandinavians | 88.2 /100 | #132 | Excellent 61.0% |
| Immigrants | Uzbekistan | 88.0 /100 | #133 | Excellent 61.0% |
| Immigrants | Venezuela | 87.9 /100 | #134 | Excellent 61.0% |
| Immigrants | Uganda | 87.4 /100 | #135 | Excellent 60.9% |
| Basques | 87.2 /100 | #136 | Excellent 60.9% |
Demographics Similar to Finns by College, 1 year or more
In terms of college, 1 year or more, the demographic groups most similar to Finns are Sudanese (60.2%, a difference of 0.0%), Moroccan (60.2%, a difference of 0.0%), Sierra Leonean (60.2%, a difference of 0.080%), Immigrants from Germany (60.3%, a difference of 0.22%), and Immigrants from Armenia (60.0%, a difference of 0.26%).
| Demographics | Rating | Rank | College, 1 year or more |
| Brazilians | 79.0 /100 | #149 | Good 60.5% |
| Immigrants | Sudan | 77.8 /100 | #150 | Good 60.4% |
| Albanians | 77.8 /100 | #151 | Good 60.4% |
| Immigrants | Germany | 76.1 /100 | #152 | Good 60.3% |
| Sierra Leoneans | 74.1 /100 | #153 | Good 60.2% |
| Sudanese | 73.0 /100 | #154 | Good 60.2% |
| Moroccans | 72.9 /100 | #155 | Good 60.2% |
| Finns | 72.9 /100 | #156 | Good 60.2% |
| Immigrants | Armenia | 68.8 /100 | #157 | Good 60.0% |
| English | 67.2 /100 | #158 | Good 60.0% |
| Immigrants | Iraq | 67.0 /100 | #159 | Good 60.0% |
| South American Indians | 66.9 /100 | #160 | Good 60.0% |
| Somalis | 64.5 /100 | #161 | Good 59.9% |
| Koreans | 58.5 /100 | #162 | Average 59.7% |
| Immigrants | Somalia | 58.3 /100 | #163 | Average 59.7% |