Ugandan vs Immigrants from Vietnam College, 1 year or more
COMPARE
Ugandan
Immigrants from Vietnam
College, 1 year or more
College, 1 year or more Comparison
Ugandans
Immigrants from Vietnam
61.2%
COLLEGE, 1 YEAR OR MORE
90.7/ 100
METRIC RATING
129th/ 347
METRIC RANK
58.2%
COLLEGE, 1 YEAR OR MORE
18.2/ 100
METRIC RATING
206th/ 347
METRIC RANK
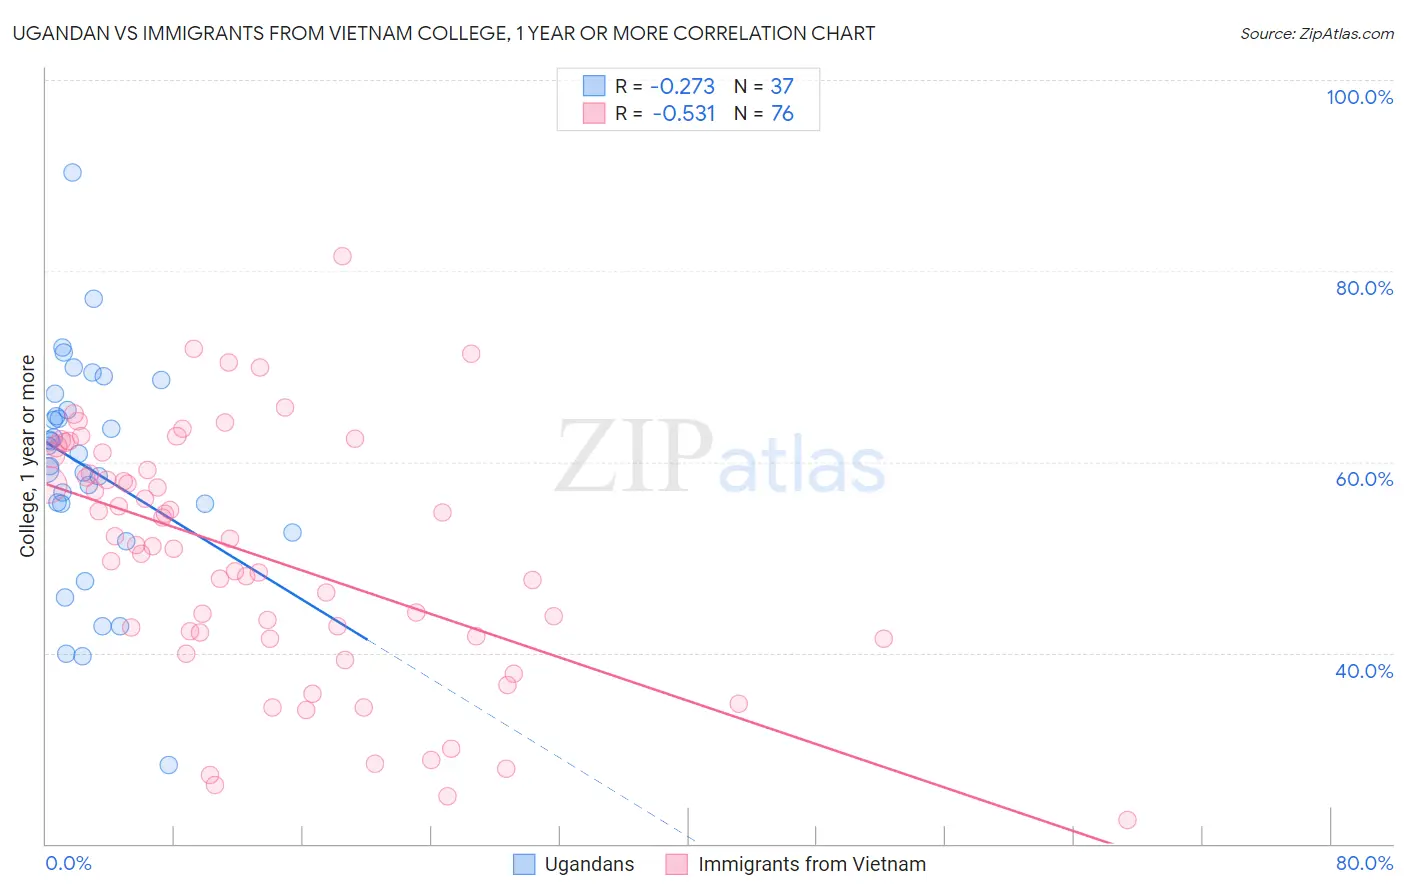
Ugandan vs Immigrants from Vietnam College, 1 year or more Correlation Chart
The statistical analysis conducted on geographies consisting of 94,018,576 people shows a weak negative correlation between the proportion of Ugandans and percentage of population with at least college, 1 year or more education in the United States with a correlation coefficient (R) of -0.273 and weighted average of 61.2%. Similarly, the statistical analysis conducted on geographies consisting of 404,840,629 people shows a substantial negative correlation between the proportion of Immigrants from Vietnam and percentage of population with at least college, 1 year or more education in the United States with a correlation coefficient (R) of -0.531 and weighted average of 58.2%, a difference of 5.1%.
College, 1 year or more Correlation Summary
| Measurement | Ugandan | Immigrants from Vietnam |
| Minimum | 28.3% | 22.4% |
| Maximum | 90.3% | 81.5% |
| Range | 62.0% | 59.1% |
| Mean | 59.3% | 50.1% |
| Median | 60.9% | 51.3% |
| Interquartile 25% (IQ1) | 54.1% | 41.6% |
| Interquartile 75% (IQ3) | 66.3% | 60.0% |
| Interquartile Range (IQR) | 12.2% | 18.4% |
| Standard Deviation (Sample) | 11.7% | 12.9% |
| Standard Deviation (Population) | 11.6% | 12.8% |
Similar Demographics by College, 1 year or more
Demographics Similar to Ugandans by College, 1 year or more
In terms of college, 1 year or more, the demographic groups most similar to Ugandans are Immigrants from Italy (61.2%, a difference of 0.060%), Immigrants from Eastern Africa (61.2%, a difference of 0.070%), Alsatian (61.3%, a difference of 0.090%), Immigrants from Syria (61.3%, a difference of 0.14%), and Italian (61.1%, a difference of 0.18%).
| Demographics | Rating | Rank | College, 1 year or more |
| Immigrants | Chile | 92.3 /100 | #122 | Exceptional 61.4% |
| Serbians | 92.2 /100 | #123 | Exceptional 61.4% |
| Venezuelans | 92.1 /100 | #124 | Exceptional 61.3% |
| Immigrants | Syria | 91.6 /100 | #125 | Exceptional 61.3% |
| Alsatians | 91.3 /100 | #126 | Exceptional 61.3% |
| Immigrants | Eastern Africa | 91.1 /100 | #127 | Exceptional 61.2% |
| Immigrants | Italy | 91.1 /100 | #128 | Exceptional 61.2% |
| Ugandans | 90.7 /100 | #129 | Exceptional 61.2% |
| Italians | 89.5 /100 | #130 | Excellent 61.1% |
| Immigrants | Morocco | 89.5 /100 | #131 | Excellent 61.1% |
| Scandinavians | 88.2 /100 | #132 | Excellent 61.0% |
| Immigrants | Uzbekistan | 88.0 /100 | #133 | Excellent 61.0% |
| Immigrants | Venezuela | 87.9 /100 | #134 | Excellent 61.0% |
| Immigrants | Uganda | 87.4 /100 | #135 | Excellent 60.9% |
| Basques | 87.2 /100 | #136 | Excellent 60.9% |
Demographics Similar to Immigrants from Vietnam by College, 1 year or more
In terms of college, 1 year or more, the demographic groups most similar to Immigrants from Vietnam are Immigrants from Zaire (58.3%, a difference of 0.040%), Panamanian (58.3%, a difference of 0.090%), Senegalese (58.2%, a difference of 0.12%), Ghanaian (58.4%, a difference of 0.23%), and Immigrants from Uruguay (58.1%, a difference of 0.29%).
| Demographics | Rating | Rank | College, 1 year or more |
| Slovaks | 24.6 /100 | #199 | Fair 58.5% |
| Spanish | 24.2 /100 | #200 | Fair 58.5% |
| Nigerians | 23.0 /100 | #201 | Fair 58.5% |
| Immigrants | South America | 21.9 /100 | #202 | Fair 58.4% |
| Ghanaians | 20.9 /100 | #203 | Fair 58.4% |
| Panamanians | 19.2 /100 | #204 | Poor 58.3% |
| Immigrants | Zaire | 18.7 /100 | #205 | Poor 58.3% |
| Immigrants | Vietnam | 18.2 /100 | #206 | Poor 58.2% |
| Senegalese | 16.9 /100 | #207 | Poor 58.2% |
| Immigrants | Uruguay | 15.2 /100 | #208 | Poor 58.1% |
| Immigrants | Middle Africa | 14.0 /100 | #209 | Poor 58.0% |
| Tsimshian | 13.5 /100 | #210 | Poor 57.9% |
| Immigrants | Nigeria | 13.3 /100 | #211 | Poor 57.9% |
| Immigrants | Senegal | 11.8 /100 | #212 | Poor 57.8% |
| French Canadians | 11.8 /100 | #213 | Poor 57.8% |