Haitian vs Spanish American Associate's Degree
COMPARE
Haitian
Spanish American
Associate's Degree
Associate's Degree Comparison
Haitians
Spanish Americans
40.0%
ASSOCIATE'S DEGREE
0.1/ 100
METRIC RATING
283rd/ 347
METRIC RANK
41.8%
ASSOCIATE'S DEGREE
0.5/ 100
METRIC RATING
257th/ 347
METRIC RANK
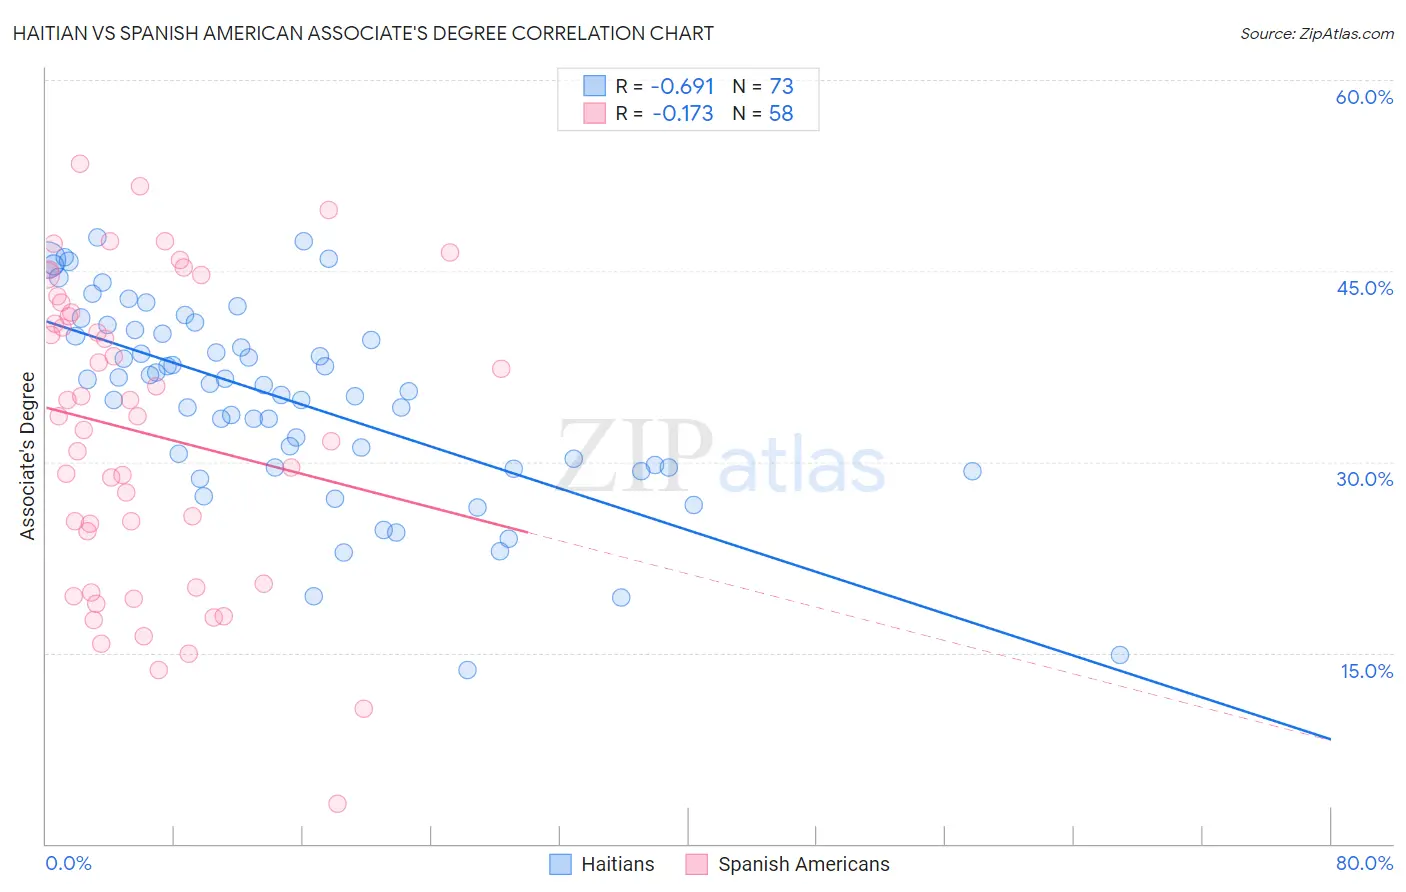
Haitian vs Spanish American Associate's Degree Correlation Chart
The statistical analysis conducted on geographies consisting of 287,980,530 people shows a significant negative correlation between the proportion of Haitians and percentage of population with at least associate's degree education in the United States with a correlation coefficient (R) of -0.691 and weighted average of 40.0%. Similarly, the statistical analysis conducted on geographies consisting of 103,167,704 people shows a poor negative correlation between the proportion of Spanish Americans and percentage of population with at least associate's degree education in the United States with a correlation coefficient (R) of -0.173 and weighted average of 41.8%, a difference of 4.5%.
Associate's Degree Correlation Summary
| Measurement | Haitian | Spanish American |
| Minimum | 13.6% | 3.1% |
| Maximum | 47.6% | 53.4% |
| Range | 34.0% | 50.3% |
| Mean | 34.8% | 32.2% |
| Median | 36.1% | 33.5% |
| Interquartile 25% (IQ1) | 29.5% | 20.5% |
| Interquartile 75% (IQ3) | 40.2% | 41.7% |
| Interquartile Range (IQR) | 10.7% | 21.2% |
| Standard Deviation (Sample) | 7.7% | 11.9% |
| Standard Deviation (Population) | 7.6% | 11.8% |
Similar Demographics by Associate's Degree
Demographics Similar to Haitians by Associate's Degree
In terms of associate's degree, the demographic groups most similar to Haitians are Comanche (39.9%, a difference of 0.12%), Bangladeshi (40.0%, a difference of 0.15%), Immigrants from Belize (39.9%, a difference of 0.21%), Immigrants from Portugal (40.1%, a difference of 0.46%), and Immigrants from Caribbean (39.7%, a difference of 0.55%).
| Demographics | Rating | Rank | Associate's Degree |
| Puerto Ricans | 0.1 /100 | #276 | Tragic 40.4% |
| Blackfeet | 0.1 /100 | #277 | Tragic 40.3% |
| Ottawa | 0.1 /100 | #278 | Tragic 40.3% |
| Immigrants | Nicaragua | 0.1 /100 | #279 | Tragic 40.3% |
| Immigrants | Micronesia | 0.1 /100 | #280 | Tragic 40.2% |
| Immigrants | Portugal | 0.1 /100 | #281 | Tragic 40.1% |
| Bangladeshis | 0.1 /100 | #282 | Tragic 40.0% |
| Haitians | 0.1 /100 | #283 | Tragic 40.0% |
| Comanche | 0.1 /100 | #284 | Tragic 39.9% |
| Immigrants | Belize | 0.1 /100 | #285 | Tragic 39.9% |
| Immigrants | Caribbean | 0.0 /100 | #286 | Tragic 39.7% |
| Aleuts | 0.0 /100 | #287 | Tragic 39.6% |
| Immigrants | Cuba | 0.0 /100 | #288 | Tragic 39.5% |
| Central Americans | 0.0 /100 | #289 | Tragic 39.4% |
| Immigrants | Haiti | 0.0 /100 | #290 | Tragic 39.3% |
Demographics Similar to Spanish Americans by Associate's Degree
In terms of associate's degree, the demographic groups most similar to Spanish Americans are Immigrants from Congo (41.8%, a difference of 0.060%), Immigrants from Guyana (41.8%, a difference of 0.18%), Japanese (41.7%, a difference of 0.22%), Cuban (41.9%, a difference of 0.27%), and Malaysian (41.6%, a difference of 0.32%).
| Demographics | Rating | Rank | Associate's Degree |
| U.S. Virgin Islanders | 0.7 /100 | #250 | Tragic 42.1% |
| Immigrants | Bahamas | 0.7 /100 | #251 | Tragic 42.1% |
| French American Indians | 0.6 /100 | #252 | Tragic 42.0% |
| Indonesians | 0.6 /100 | #253 | Tragic 41.9% |
| Cubans | 0.6 /100 | #254 | Tragic 41.9% |
| Immigrants | Guyana | 0.5 /100 | #255 | Tragic 41.8% |
| Immigrants | Congo | 0.5 /100 | #256 | Tragic 41.8% |
| Spanish Americans | 0.5 /100 | #257 | Tragic 41.8% |
| Japanese | 0.5 /100 | #258 | Tragic 41.7% |
| Malaysians | 0.4 /100 | #259 | Tragic 41.6% |
| Marshallese | 0.4 /100 | #260 | Tragic 41.6% |
| Nicaraguans | 0.4 /100 | #261 | Tragic 41.5% |
| Bahamians | 0.4 /100 | #262 | Tragic 41.5% |
| Immigrants | Jamaica | 0.3 /100 | #263 | Tragic 41.5% |
| Osage | 0.3 /100 | #264 | Tragic 41.5% |