Sri Lankan vs Spanish American Associate's Degree
COMPARE
Sri Lankan
Spanish American
Associate's Degree
Associate's Degree Comparison
Sri Lankans
Spanish Americans
46.3%
ASSOCIATE'S DEGREE
47.6/ 100
METRIC RATING
179th/ 347
METRIC RANK
41.8%
ASSOCIATE'S DEGREE
0.5/ 100
METRIC RATING
257th/ 347
METRIC RANK
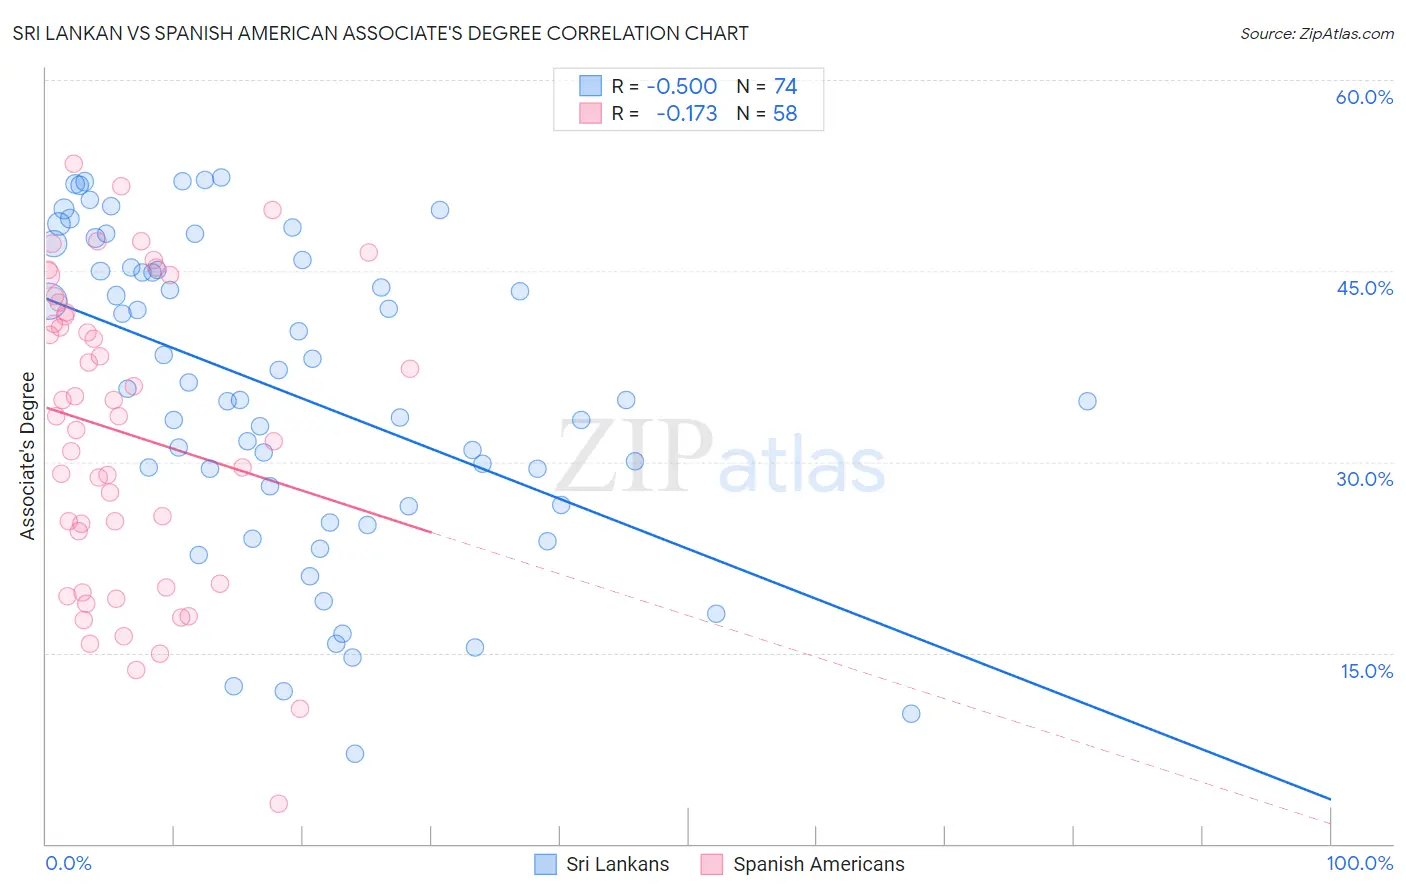
Sri Lankan vs Spanish American Associate's Degree Correlation Chart
The statistical analysis conducted on geographies consisting of 440,543,286 people shows a substantial negative correlation between the proportion of Sri Lankans and percentage of population with at least associate's degree education in the United States with a correlation coefficient (R) of -0.500 and weighted average of 46.3%. Similarly, the statistical analysis conducted on geographies consisting of 103,167,704 people shows a poor negative correlation between the proportion of Spanish Americans and percentage of population with at least associate's degree education in the United States with a correlation coefficient (R) of -0.173 and weighted average of 41.8%, a difference of 10.8%.
Associate's Degree Correlation Summary
| Measurement | Sri Lankan | Spanish American |
| Minimum | 7.0% | 3.1% |
| Maximum | 52.3% | 53.4% |
| Range | 45.3% | 50.3% |
| Mean | 35.4% | 32.2% |
| Median | 35.3% | 33.5% |
| Interquartile 25% (IQ1) | 26.6% | 20.5% |
| Interquartile 75% (IQ3) | 45.3% | 41.7% |
| Interquartile Range (IQR) | 18.7% | 21.2% |
| Standard Deviation (Sample) | 12.2% | 11.9% |
| Standard Deviation (Population) | 12.1% | 11.8% |
Similar Demographics by Associate's Degree
Demographics Similar to Sri Lankans by Associate's Degree
In terms of associate's degree, the demographic groups most similar to Sri Lankans are Immigrants from Bosnia and Herzegovina (46.3%, a difference of 0.050%), Slovak (46.3%, a difference of 0.060%), Finnish (46.3%, a difference of 0.070%), Bermudan (46.2%, a difference of 0.090%), and Belgian (46.3%, a difference of 0.10%).
| Demographics | Rating | Rank | Associate's Degree |
| Peruvians | 50.5 /100 | #172 | Average 46.4% |
| Immigrants | Iraq | 50.3 /100 | #173 | Average 46.4% |
| English | 50.0 /100 | #174 | Average 46.4% |
| Belgians | 48.9 /100 | #175 | Average 46.3% |
| Finns | 48.5 /100 | #176 | Average 46.3% |
| Slovaks | 48.4 /100 | #177 | Average 46.3% |
| Immigrants | Bosnia and Herzegovina | 48.3 /100 | #178 | Average 46.3% |
| Sri Lankans | 47.6 /100 | #179 | Average 46.3% |
| Bermudans | 46.4 /100 | #180 | Average 46.2% |
| Immigrants | Colombia | 41.3 /100 | #181 | Average 46.0% |
| Swiss | 40.4 /100 | #182 | Average 46.0% |
| Yugoslavians | 40.2 /100 | #183 | Average 46.0% |
| Czechoslovakians | 40.0 /100 | #184 | Average 46.0% |
| Costa Ricans | 38.6 /100 | #185 | Fair 46.0% |
| Welsh | 37.9 /100 | #186 | Fair 45.9% |
Demographics Similar to Spanish Americans by Associate's Degree
In terms of associate's degree, the demographic groups most similar to Spanish Americans are Immigrants from Congo (41.8%, a difference of 0.060%), Immigrants from Guyana (41.8%, a difference of 0.18%), Japanese (41.7%, a difference of 0.22%), Cuban (41.9%, a difference of 0.27%), and Malaysian (41.6%, a difference of 0.32%).
| Demographics | Rating | Rank | Associate's Degree |
| U.S. Virgin Islanders | 0.7 /100 | #250 | Tragic 42.1% |
| Immigrants | Bahamas | 0.7 /100 | #251 | Tragic 42.1% |
| French American Indians | 0.6 /100 | #252 | Tragic 42.0% |
| Indonesians | 0.6 /100 | #253 | Tragic 41.9% |
| Cubans | 0.6 /100 | #254 | Tragic 41.9% |
| Immigrants | Guyana | 0.5 /100 | #255 | Tragic 41.8% |
| Immigrants | Congo | 0.5 /100 | #256 | Tragic 41.8% |
| Spanish Americans | 0.5 /100 | #257 | Tragic 41.8% |
| Japanese | 0.5 /100 | #258 | Tragic 41.7% |
| Malaysians | 0.4 /100 | #259 | Tragic 41.6% |
| Marshallese | 0.4 /100 | #260 | Tragic 41.6% |
| Nicaraguans | 0.4 /100 | #261 | Tragic 41.5% |
| Bahamians | 0.4 /100 | #262 | Tragic 41.5% |
| Immigrants | Jamaica | 0.3 /100 | #263 | Tragic 41.5% |
| Osage | 0.3 /100 | #264 | Tragic 41.5% |