Turkish vs Immigrants from South Africa Ambulatory Disability
COMPARE
Turkish
Immigrants from South Africa
Ambulatory Disability
Ambulatory Disability Comparison
Turks
Immigrants from South Africa
5.5%
AMBULATORY DISABILITY
100.0/ 100
METRIC RATING
37th/ 347
METRIC RANK
5.7%
AMBULATORY DISABILITY
99.3/ 100
METRIC RATING
75th/ 347
METRIC RANK
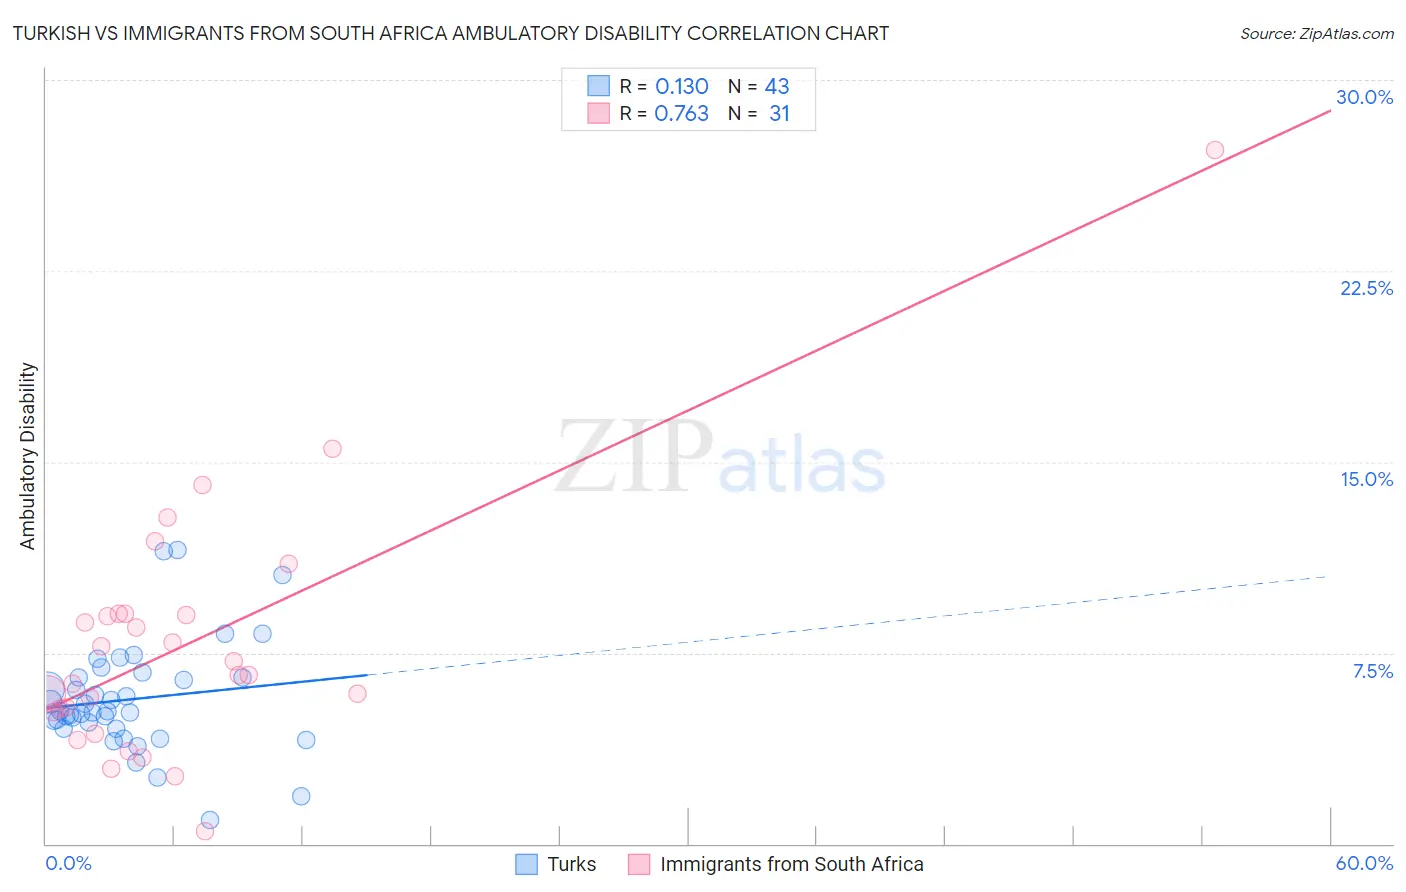
Turkish vs Immigrants from South Africa Ambulatory Disability Correlation Chart
The statistical analysis conducted on geographies consisting of 271,801,732 people shows a poor positive correlation between the proportion of Turks and percentage of population with ambulatory disability in the United States with a correlation coefficient (R) of 0.130 and weighted average of 5.5%. Similarly, the statistical analysis conducted on geographies consisting of 233,268,950 people shows a strong positive correlation between the proportion of Immigrants from South Africa and percentage of population with ambulatory disability in the United States with a correlation coefficient (R) of 0.763 and weighted average of 5.7%, a difference of 4.2%.
Ambulatory Disability Correlation Summary
| Measurement | Turkish | Immigrants from South Africa |
| Minimum | 0.92% | 0.47% |
| Maximum | 11.5% | 27.3% |
| Range | 10.6% | 26.8% |
| Mean | 5.7% | 7.8% |
| Median | 5.2% | 6.6% |
| Interquartile 25% (IQ1) | 4.5% | 5.2% |
| Interquartile 75% (IQ3) | 6.5% | 9.0% |
| Interquartile Range (IQR) | 2.0% | 3.8% |
| Standard Deviation (Sample) | 2.1% | 5.0% |
| Standard Deviation (Population) | 2.1% | 4.9% |
Similar Demographics by Ambulatory Disability
Demographics Similar to Turks by Ambulatory Disability
In terms of ambulatory disability, the demographic groups most similar to Turks are Cypriot (5.5%, a difference of 0.010%), Immigrants from Malaysia (5.5%, a difference of 0.020%), Afghan (5.5%, a difference of 0.080%), Immigrants from Eritrea (5.5%, a difference of 0.090%), and Immigrants from Asia (5.5%, a difference of 0.13%).
| Demographics | Rating | Rank | Ambulatory Disability |
| Immigrants | Turkey | 100.0 /100 | #30 | Exceptional 5.4% |
| Immigrants | Venezuela | 100.0 /100 | #31 | Exceptional 5.4% |
| Immigrants | Australia | 100.0 /100 | #32 | Exceptional 5.5% |
| Immigrants | Pakistan | 100.0 /100 | #33 | Exceptional 5.5% |
| Immigrants | Asia | 100.0 /100 | #34 | Exceptional 5.5% |
| Afghans | 100.0 /100 | #35 | Exceptional 5.5% |
| Immigrants | Malaysia | 100.0 /100 | #36 | Exceptional 5.5% |
| Turks | 100.0 /100 | #37 | Exceptional 5.5% |
| Cypriots | 100.0 /100 | #38 | Exceptional 5.5% |
| Immigrants | Eritrea | 100.0 /100 | #39 | Exceptional 5.5% |
| Venezuelans | 99.9 /100 | #40 | Exceptional 5.5% |
| Mongolians | 99.9 /100 | #41 | Exceptional 5.5% |
| Argentineans | 99.9 /100 | #42 | Exceptional 5.5% |
| Paraguayans | 99.9 /100 | #43 | Exceptional 5.5% |
| Immigrants | Indonesia | 99.9 /100 | #44 | Exceptional 5.5% |
Demographics Similar to Immigrants from South Africa by Ambulatory Disability
In terms of ambulatory disability, the demographic groups most similar to Immigrants from South Africa are Sudanese (5.7%, a difference of 0.020%), Immigrants from Cameroon (5.7%, a difference of 0.050%), Immigrants from Northern Africa (5.7%, a difference of 0.060%), Brazilian (5.7%, a difference of 0.070%), and Immigrants from Peru (5.7%, a difference of 0.090%).
| Demographics | Rating | Rank | Ambulatory Disability |
| Sri Lankans | 99.6 /100 | #68 | Exceptional 5.7% |
| Peruvians | 99.5 /100 | #69 | Exceptional 5.7% |
| Sierra Leoneans | 99.4 /100 | #70 | Exceptional 5.7% |
| Immigrants | Peru | 99.4 /100 | #71 | Exceptional 5.7% |
| Brazilians | 99.4 /100 | #72 | Exceptional 5.7% |
| Immigrants | Northern Africa | 99.4 /100 | #73 | Exceptional 5.7% |
| Immigrants | Cameroon | 99.4 /100 | #74 | Exceptional 5.7% |
| Immigrants | South Africa | 99.3 /100 | #75 | Exceptional 5.7% |
| Sudanese | 99.3 /100 | #76 | Exceptional 5.7% |
| Immigrants | Vietnam | 99.3 /100 | #77 | Exceptional 5.7% |
| Somalis | 99.2 /100 | #78 | Exceptional 5.7% |
| Chileans | 99.2 /100 | #79 | Exceptional 5.7% |
| Immigrants | Ireland | 99.2 /100 | #80 | Exceptional 5.7% |
| Immigrants | Jordan | 99.2 /100 | #81 | Exceptional 5.7% |
| Palestinians | 99.2 /100 | #82 | Exceptional 5.7% |