Turkish vs Immigrants from South Africa Unemployment Among Youth under 25 years
COMPARE
Turkish
Immigrants from South Africa
Unemployment Among Youth under 25 years
Unemployment Among Youth under 25 years Comparison
Turks
Immigrants from South Africa
11.4%
UNEMPLOYMENT AMONG YOUTH UNDER 25 YEARS
85.8/ 100
METRIC RATING
129th/ 347
METRIC RANK
11.2%
UNEMPLOYMENT AMONG YOUTH UNDER 25 YEARS
95.8/ 100
METRIC RATING
86th/ 347
METRIC RANK
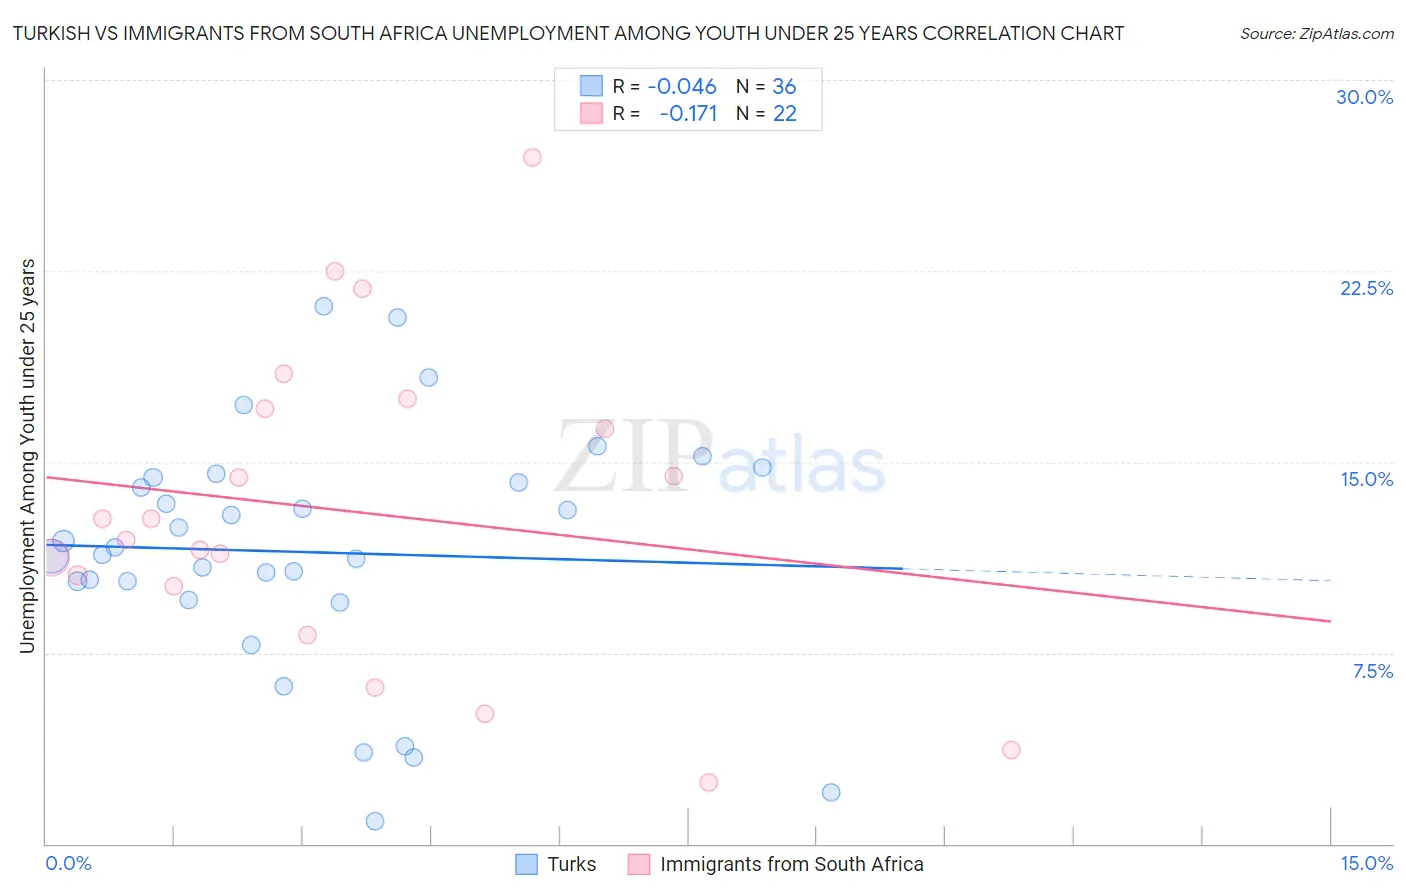
Turkish vs Immigrants from South Africa Unemployment Among Youth under 25 years Correlation Chart
The statistical analysis conducted on geographies consisting of 269,922,235 people shows no correlation between the proportion of Turks and unemployment rate among youth under the age of 25 in the United States with a correlation coefficient (R) of -0.046 and weighted average of 11.4%. Similarly, the statistical analysis conducted on geographies consisting of 231,618,712 people shows a poor negative correlation between the proportion of Immigrants from South Africa and unemployment rate among youth under the age of 25 in the United States with a correlation coefficient (R) of -0.171 and weighted average of 11.2%, a difference of 1.4%.
Unemployment Among Youth under 25 years Correlation Summary
| Measurement | Turkish | Immigrants from South Africa |
| Minimum | 0.90% | 2.4% |
| Maximum | 21.1% | 26.9% |
| Range | 20.2% | 24.5% |
| Mean | 11.5% | 13.1% |
| Median | 11.5% | 12.3% |
| Interquartile 25% (IQ1) | 9.9% | 10.1% |
| Interquartile 75% (IQ3) | 14.3% | 17.1% |
| Interquartile Range (IQR) | 4.4% | 6.9% |
| Standard Deviation (Sample) | 4.7% | 6.2% |
| Standard Deviation (Population) | 4.7% | 6.0% |
Similar Demographics by Unemployment Among Youth under 25 years
Demographics Similar to Turks by Unemployment Among Youth under 25 years
In terms of unemployment among youth under 25 years, the demographic groups most similar to Turks are Hungarian (11.4%, a difference of 0.010%), Immigrants from Hungary (11.4%, a difference of 0.020%), Greek (11.4%, a difference of 0.030%), Canadian (11.4%, a difference of 0.070%), and Immigrants from Spain (11.4%, a difference of 0.10%).
| Demographics | Rating | Rank | Unemployment Among Youth under 25 years |
| Immigrants | Micronesia | 88.1 /100 | #122 | Excellent 11.4% |
| Basques | 87.8 /100 | #123 | Excellent 11.4% |
| Italians | 87.2 /100 | #124 | Excellent 11.4% |
| Immigrants | Argentina | 87.2 /100 | #125 | Excellent 11.4% |
| Canadians | 86.6 /100 | #126 | Excellent 11.4% |
| Greeks | 86.2 /100 | #127 | Excellent 11.4% |
| Immigrants | Hungary | 86.0 /100 | #128 | Excellent 11.4% |
| Turks | 85.8 /100 | #129 | Excellent 11.4% |
| Hungarians | 85.7 /100 | #130 | Excellent 11.4% |
| Immigrants | Spain | 84.6 /100 | #131 | Excellent 11.4% |
| Ethiopians | 83.2 /100 | #132 | Excellent 11.4% |
| Lebanese | 83.1 /100 | #133 | Excellent 11.4% |
| Immigrants | Chile | 80.4 /100 | #134 | Excellent 11.4% |
| Immigrants | Oceania | 80.2 /100 | #135 | Excellent 11.4% |
| Romanians | 80.1 /100 | #136 | Excellent 11.4% |
Demographics Similar to Immigrants from South Africa by Unemployment Among Youth under 25 years
In terms of unemployment among youth under 25 years, the demographic groups most similar to Immigrants from South Africa are Kenyan (11.2%, a difference of 0.010%), French Canadian (11.2%, a difference of 0.030%), Immigrants from South Central Asia (11.2%, a difference of 0.030%), Bolivian (11.2%, a difference of 0.070%), and Austrian (11.2%, a difference of 0.070%).
| Demographics | Rating | Rank | Unemployment Among Youth under 25 years |
| Immigrants | Canada | 96.7 /100 | #79 | Exceptional 11.2% |
| Immigrants | Bulgaria | 96.4 /100 | #80 | Exceptional 11.2% |
| Icelanders | 96.3 /100 | #81 | Exceptional 11.2% |
| Northern Europeans | 96.2 /100 | #82 | Exceptional 11.2% |
| Bolivians | 96.1 /100 | #83 | Exceptional 11.2% |
| French Canadians | 95.9 /100 | #84 | Exceptional 11.2% |
| Immigrants | South Central Asia | 95.9 /100 | #85 | Exceptional 11.2% |
| Immigrants | South Africa | 95.8 /100 | #86 | Exceptional 11.2% |
| Kenyans | 95.7 /100 | #87 | Exceptional 11.2% |
| Austrians | 95.5 /100 | #88 | Exceptional 11.2% |
| Immigrants | Japan | 95.5 /100 | #89 | Exceptional 11.2% |
| Immigrants | Bolivia | 95.5 /100 | #90 | Exceptional 11.2% |
| Immigrants | Taiwan | 95.1 /100 | #91 | Exceptional 11.2% |
| Immigrants | Latvia | 95.1 /100 | #92 | Exceptional 11.2% |
| Immigrants | North America | 95.1 /100 | #93 | Exceptional 11.2% |