French American Indian vs Immigrants from Peru Associate's Degree
COMPARE
French American Indian
Immigrants from Peru
Associate's Degree
Associate's Degree Comparison
French American Indians
Immigrants from Peru
42.0%
ASSOCIATE'S DEGREE
0.6/ 100
METRIC RATING
252nd/ 347
METRIC RANK
45.5%
ASSOCIATE'S DEGREE
27.6/ 100
METRIC RATING
194th/ 347
METRIC RANK
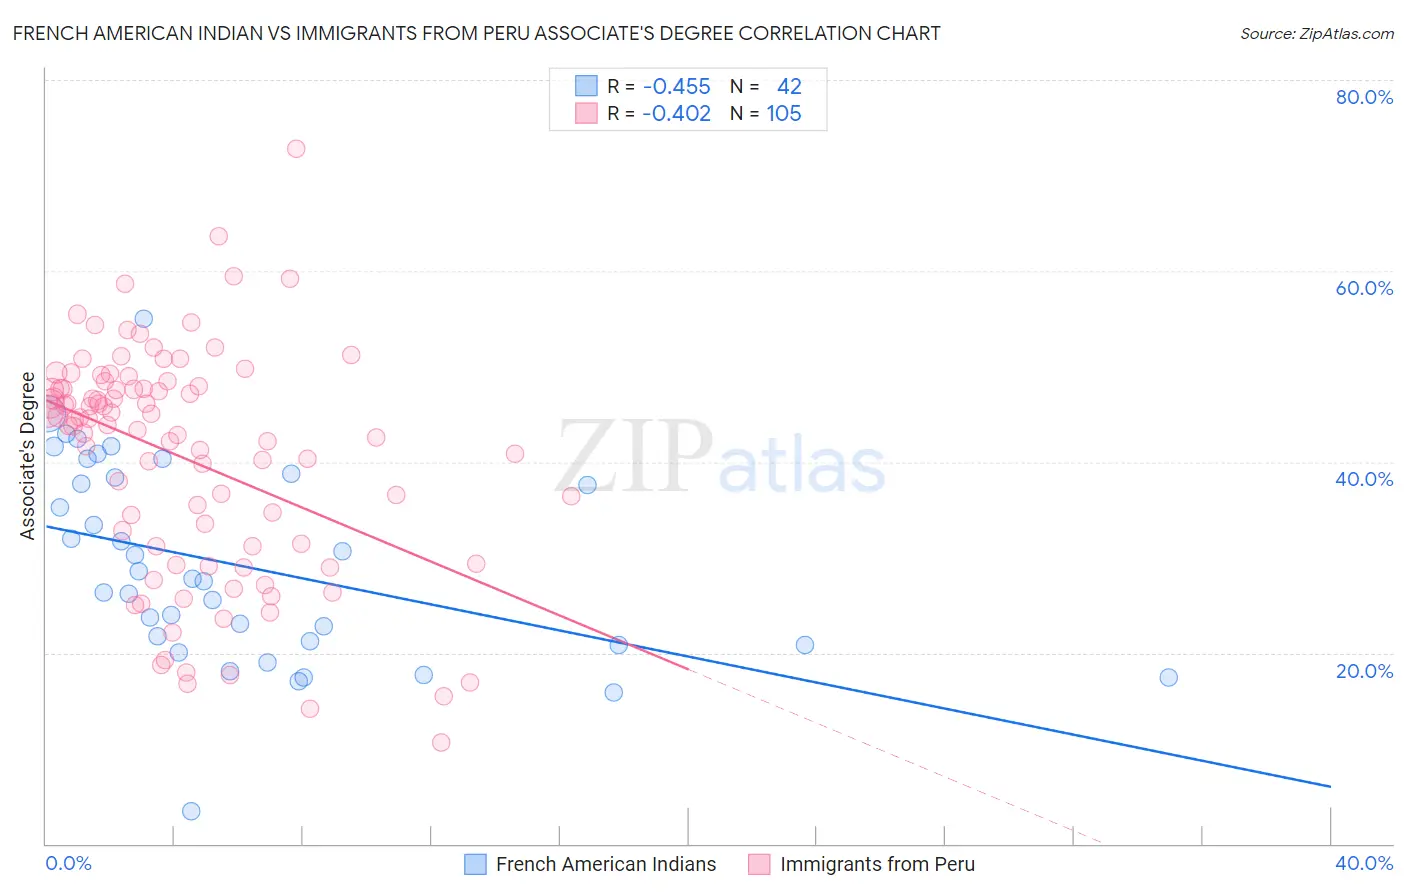
French American Indian vs Immigrants from Peru Associate's Degree Correlation Chart
The statistical analysis conducted on geographies consisting of 131,974,565 people shows a moderate negative correlation between the proportion of French American Indians and percentage of population with at least associate's degree education in the United States with a correlation coefficient (R) of -0.455 and weighted average of 42.0%. Similarly, the statistical analysis conducted on geographies consisting of 328,856,641 people shows a moderate negative correlation between the proportion of Immigrants from Peru and percentage of population with at least associate's degree education in the United States with a correlation coefficient (R) of -0.402 and weighted average of 45.5%, a difference of 8.5%.
Associate's Degree Correlation Summary
| Measurement | French American Indian | Immigrants from Peru |
| Minimum | 3.4% | 10.6% |
| Maximum | 55.0% | 72.7% |
| Range | 51.5% | 62.1% |
| Mean | 29.1% | 40.4% |
| Median | 27.6% | 43.8% |
| Interquartile 25% (IQ1) | 20.8% | 31.2% |
| Interquartile 75% (IQ3) | 38.3% | 47.8% |
| Interquartile Range (IQR) | 17.5% | 16.6% |
| Standard Deviation (Sample) | 10.5% | 12.0% |
| Standard Deviation (Population) | 10.4% | 11.9% |
Similar Demographics by Associate's Degree
Demographics Similar to French American Indians by Associate's Degree
In terms of associate's degree, the demographic groups most similar to French American Indians are Indonesian (41.9%, a difference of 0.10%), Cuban (41.9%, a difference of 0.17%), Immigrants from Guyana (41.8%, a difference of 0.25%), Immigrants from Bahamas (42.1%, a difference of 0.36%), and U.S. Virgin Islander (42.1%, a difference of 0.38%).
| Demographics | Rating | Rank | Associate's Degree |
| Immigrants | Cambodia | 0.9 /100 | #245 | Tragic 42.3% |
| Delaware | 0.9 /100 | #246 | Tragic 42.3% |
| Immigrants | Fiji | 0.8 /100 | #247 | Tragic 42.2% |
| Immigrants | Ecuador | 0.8 /100 | #248 | Tragic 42.2% |
| Jamaicans | 0.7 /100 | #249 | Tragic 42.1% |
| U.S. Virgin Islanders | 0.7 /100 | #250 | Tragic 42.1% |
| Immigrants | Bahamas | 0.7 /100 | #251 | Tragic 42.1% |
| French American Indians | 0.6 /100 | #252 | Tragic 42.0% |
| Indonesians | 0.6 /100 | #253 | Tragic 41.9% |
| Cubans | 0.6 /100 | #254 | Tragic 41.9% |
| Immigrants | Guyana | 0.5 /100 | #255 | Tragic 41.8% |
| Immigrants | Congo | 0.5 /100 | #256 | Tragic 41.8% |
| Spanish Americans | 0.5 /100 | #257 | Tragic 41.8% |
| Japanese | 0.5 /100 | #258 | Tragic 41.7% |
| Malaysians | 0.4 /100 | #259 | Tragic 41.6% |
Demographics Similar to Immigrants from Peru by Associate's Degree
In terms of associate's degree, the demographic groups most similar to Immigrants from Peru are German (45.5%, a difference of 0.10%), French (45.4%, a difference of 0.19%), Immigrants from Cameroon (45.7%, a difference of 0.32%), Celtic (45.8%, a difference of 0.51%), and Scotch-Irish (45.3%, a difference of 0.54%).
| Demographics | Rating | Rank | Associate's Degree |
| Immigrants | Uruguay | 35.5 /100 | #187 | Fair 45.8% |
| Ghanaians | 35.5 /100 | #188 | Fair 45.8% |
| Immigrants | Oceania | 34.7 /100 | #189 | Fair 45.8% |
| Vietnamese | 34.0 /100 | #190 | Fair 45.8% |
| Koreans | 33.8 /100 | #191 | Fair 45.8% |
| Celtics | 33.3 /100 | #192 | Fair 45.8% |
| Immigrants | Cameroon | 31.0 /100 | #193 | Fair 45.7% |
| Immigrants | Peru | 27.6 /100 | #194 | Fair 45.5% |
| Germans | 26.5 /100 | #195 | Fair 45.5% |
| French | 25.6 /100 | #196 | Fair 45.4% |
| Scotch-Irish | 22.3 /100 | #197 | Fair 45.3% |
| Immigrants | Bangladesh | 21.3 /100 | #198 | Fair 45.2% |
| Immigrants | Senegal | 21.2 /100 | #199 | Fair 45.2% |
| Senegalese | 21.1 /100 | #200 | Fair 45.2% |
| Immigrants | Vietnam | 20.8 /100 | #201 | Fair 45.2% |