Arapaho vs Immigrants from Peru Associate's Degree
COMPARE
Arapaho
Immigrants from Peru
Associate's Degree
Associate's Degree Comparison
Arapaho
Immigrants from Peru
36.7%
ASSOCIATE'S DEGREE
0.0/ 100
METRIC RATING
324th/ 347
METRIC RANK
45.5%
ASSOCIATE'S DEGREE
27.6/ 100
METRIC RATING
194th/ 347
METRIC RANK
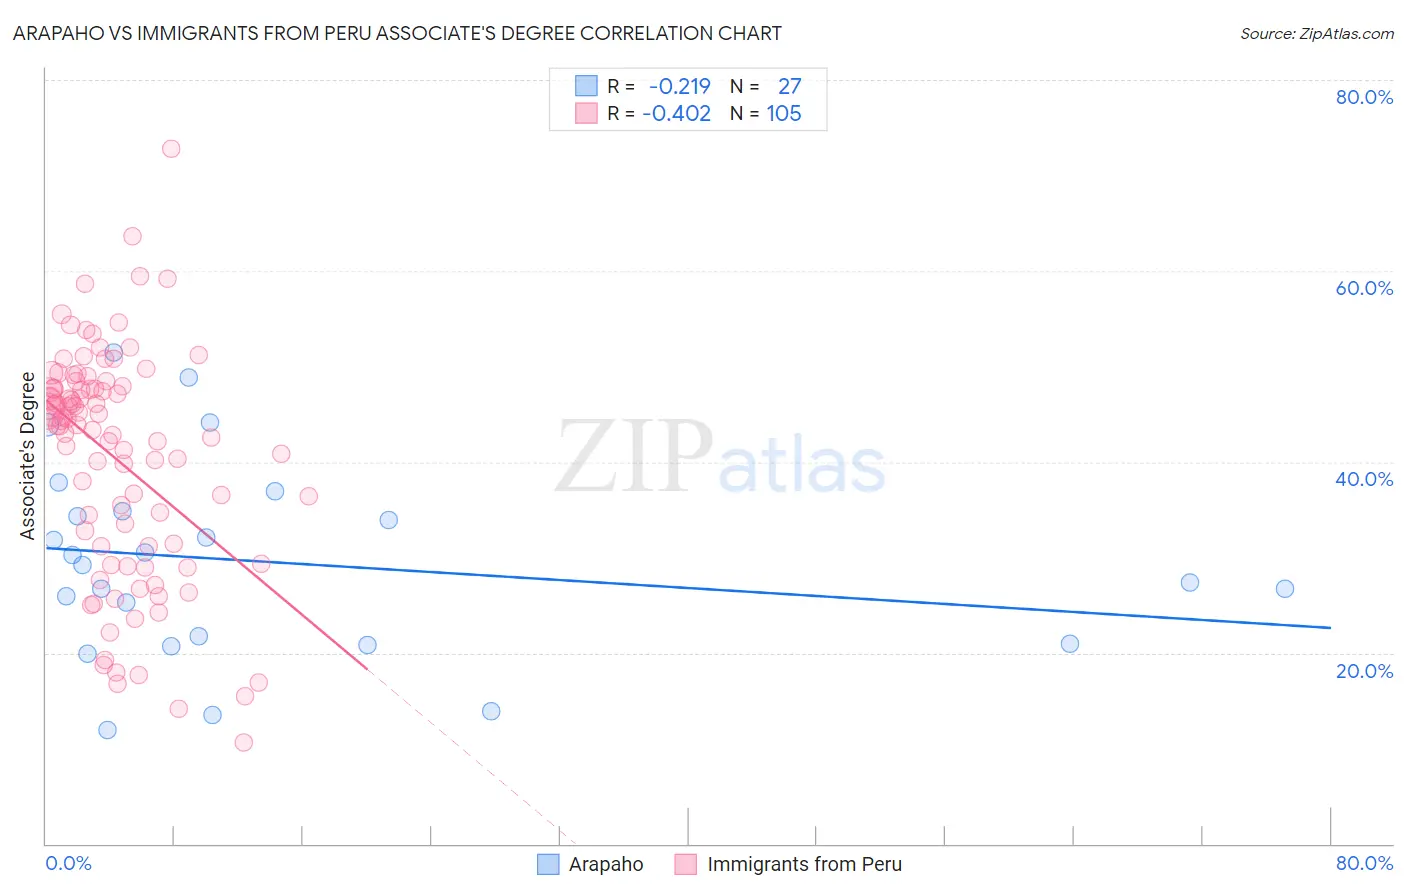
Arapaho vs Immigrants from Peru Associate's Degree Correlation Chart
The statistical analysis conducted on geographies consisting of 29,779,330 people shows a weak negative correlation between the proportion of Arapaho and percentage of population with at least associate's degree education in the United States with a correlation coefficient (R) of -0.219 and weighted average of 36.7%. Similarly, the statistical analysis conducted on geographies consisting of 328,856,641 people shows a moderate negative correlation between the proportion of Immigrants from Peru and percentage of population with at least associate's degree education in the United States with a correlation coefficient (R) of -0.402 and weighted average of 45.5%, a difference of 23.9%.
Associate's Degree Correlation Summary
| Measurement | Arapaho | Immigrants from Peru |
| Minimum | 11.9% | 10.6% |
| Maximum | 51.5% | 72.7% |
| Range | 39.6% | 62.1% |
| Mean | 29.5% | 40.4% |
| Median | 29.2% | 43.8% |
| Interquartile 25% (IQ1) | 21.0% | 31.2% |
| Interquartile 75% (IQ3) | 34.8% | 47.8% |
| Interquartile Range (IQR) | 13.8% | 16.6% |
| Standard Deviation (Sample) | 10.2% | 12.0% |
| Standard Deviation (Population) | 10.0% | 11.9% |
Similar Demographics by Associate's Degree
Demographics Similar to Arapaho by Associate's Degree
In terms of associate's degree, the demographic groups most similar to Arapaho are Menominee (36.7%, a difference of 0.11%), Immigrants from Cabo Verde (36.8%, a difference of 0.16%), Kiowa (36.5%, a difference of 0.67%), Dutch West Indian (36.5%, a difference of 0.69%), and Alaskan Athabascan (36.5%, a difference of 0.70%).
| Demographics | Rating | Rank | Associate's Degree |
| Yaqui | 0.0 /100 | #317 | Tragic 37.6% |
| Alaska Natives | 0.0 /100 | #318 | Tragic 37.5% |
| Fijians | 0.0 /100 | #319 | Tragic 37.4% |
| Cajuns | 0.0 /100 | #320 | Tragic 37.4% |
| Immigrants | Yemen | 0.0 /100 | #321 | Tragic 37.3% |
| Pennsylvania Germans | 0.0 /100 | #322 | Tragic 37.2% |
| Immigrants | Cabo Verde | 0.0 /100 | #323 | Tragic 36.8% |
| Arapaho | 0.0 /100 | #324 | Tragic 36.7% |
| Menominee | 0.0 /100 | #325 | Tragic 36.7% |
| Kiowa | 0.0 /100 | #326 | Tragic 36.5% |
| Dutch West Indians | 0.0 /100 | #327 | Tragic 36.5% |
| Alaskan Athabascans | 0.0 /100 | #328 | Tragic 36.5% |
| Paiute | 0.0 /100 | #329 | Tragic 36.4% |
| Apache | 0.0 /100 | #330 | Tragic 36.2% |
| Immigrants | Azores | 0.0 /100 | #331 | Tragic 35.6% |
Demographics Similar to Immigrants from Peru by Associate's Degree
In terms of associate's degree, the demographic groups most similar to Immigrants from Peru are German (45.5%, a difference of 0.10%), French (45.4%, a difference of 0.19%), Immigrants from Cameroon (45.7%, a difference of 0.32%), Celtic (45.8%, a difference of 0.51%), and Scotch-Irish (45.3%, a difference of 0.54%).
| Demographics | Rating | Rank | Associate's Degree |
| Immigrants | Uruguay | 35.5 /100 | #187 | Fair 45.8% |
| Ghanaians | 35.5 /100 | #188 | Fair 45.8% |
| Immigrants | Oceania | 34.7 /100 | #189 | Fair 45.8% |
| Vietnamese | 34.0 /100 | #190 | Fair 45.8% |
| Koreans | 33.8 /100 | #191 | Fair 45.8% |
| Celtics | 33.3 /100 | #192 | Fair 45.8% |
| Immigrants | Cameroon | 31.0 /100 | #193 | Fair 45.7% |
| Immigrants | Peru | 27.6 /100 | #194 | Fair 45.5% |
| Germans | 26.5 /100 | #195 | Fair 45.5% |
| French | 25.6 /100 | #196 | Fair 45.4% |
| Scotch-Irish | 22.3 /100 | #197 | Fair 45.3% |
| Immigrants | Bangladesh | 21.3 /100 | #198 | Fair 45.2% |
| Immigrants | Senegal | 21.2 /100 | #199 | Fair 45.2% |
| Senegalese | 21.1 /100 | #200 | Fair 45.2% |
| Immigrants | Vietnam | 20.8 /100 | #201 | Fair 45.2% |