Laotian vs Immigrants from Peru Associate's Degree
COMPARE
Laotian
Immigrants from Peru
Associate's Degree
Associate's Degree Comparison
Laotians
Immigrants from Peru
49.9%
ASSOCIATE'S DEGREE
98.4/ 100
METRIC RATING
94th/ 347
METRIC RANK
45.5%
ASSOCIATE'S DEGREE
27.6/ 100
METRIC RATING
194th/ 347
METRIC RANK
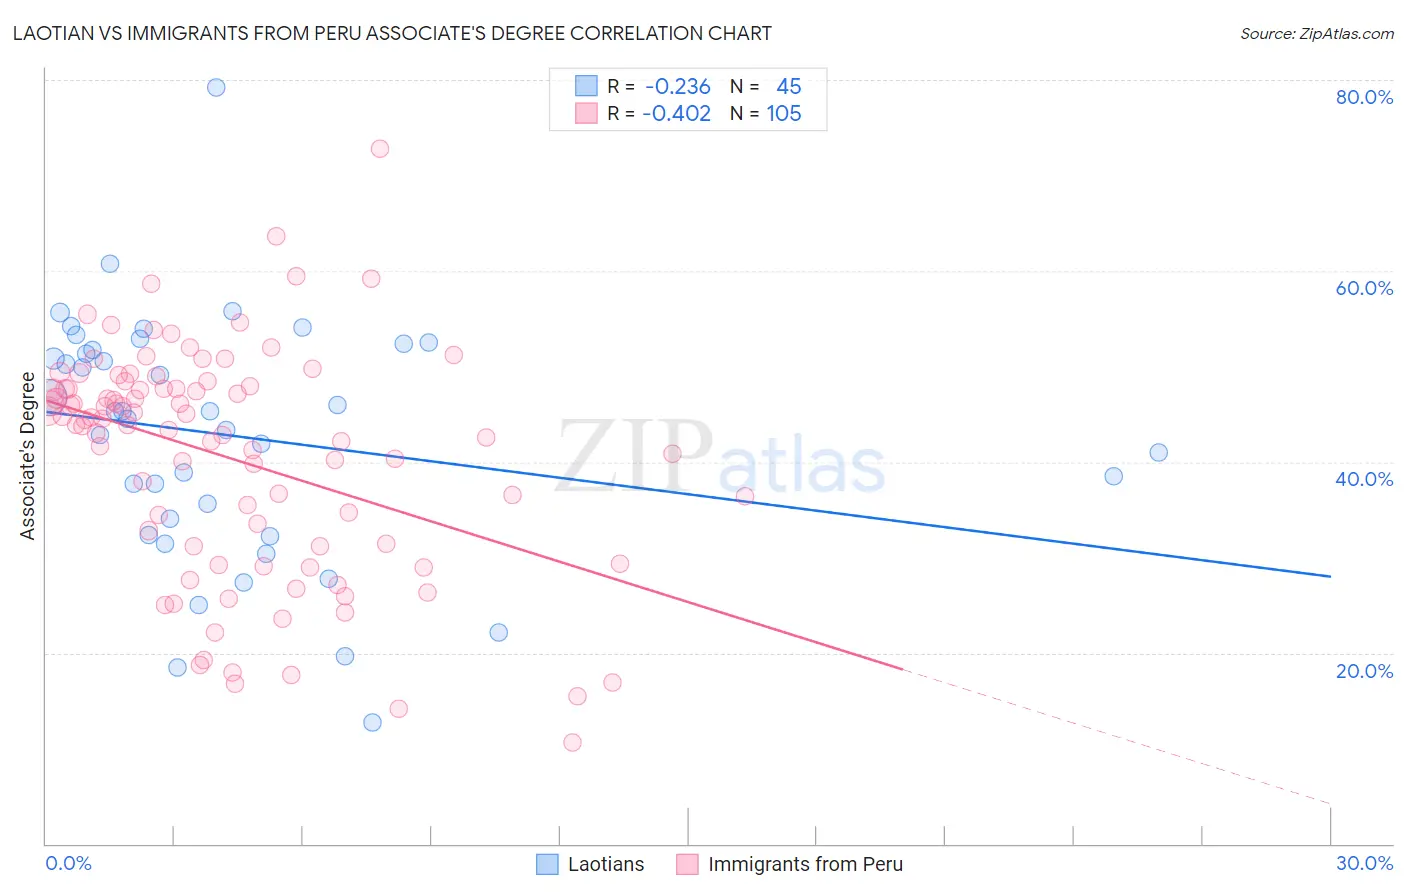
Laotian vs Immigrants from Peru Associate's Degree Correlation Chart
The statistical analysis conducted on geographies consisting of 224,847,979 people shows a weak negative correlation between the proportion of Laotians and percentage of population with at least associate's degree education in the United States with a correlation coefficient (R) of -0.236 and weighted average of 49.9%. Similarly, the statistical analysis conducted on geographies consisting of 328,856,641 people shows a moderate negative correlation between the proportion of Immigrants from Peru and percentage of population with at least associate's degree education in the United States with a correlation coefficient (R) of -0.402 and weighted average of 45.5%, a difference of 9.7%.
Associate's Degree Correlation Summary
| Measurement | Laotian | Immigrants from Peru |
| Minimum | 12.7% | 10.6% |
| Maximum | 79.2% | 72.7% |
| Range | 66.5% | 62.1% |
| Mean | 42.7% | 40.4% |
| Median | 45.3% | 43.8% |
| Interquartile 25% (IQ1) | 33.2% | 31.2% |
| Interquartile 75% (IQ3) | 52.1% | 47.8% |
| Interquartile Range (IQR) | 18.9% | 16.6% |
| Standard Deviation (Sample) | 12.8% | 12.0% |
| Standard Deviation (Population) | 12.6% | 11.9% |
Similar Demographics by Associate's Degree
Demographics Similar to Laotians by Associate's Degree
In terms of associate's degree, the demographic groups most similar to Laotians are Immigrants from Brazil (50.0%, a difference of 0.13%), Immigrants from North America (50.1%, a difference of 0.28%), Immigrants from Western Asia (50.1%, a difference of 0.31%), Immigrants from Western Europe (50.1%, a difference of 0.39%), and Immigrants from Ethiopia (50.1%, a difference of 0.39%).
| Demographics | Rating | Rank | Associate's Degree |
| Immigrants | Moldova | 98.8 /100 | #87 | Exceptional 50.2% |
| Immigrants | Canada | 98.7 /100 | #88 | Exceptional 50.1% |
| Immigrants | Western Europe | 98.7 /100 | #89 | Exceptional 50.1% |
| Immigrants | Ethiopia | 98.7 /100 | #90 | Exceptional 50.1% |
| Immigrants | Western Asia | 98.7 /100 | #91 | Exceptional 50.1% |
| Immigrants | North America | 98.7 /100 | #92 | Exceptional 50.1% |
| Immigrants | Brazil | 98.5 /100 | #93 | Exceptional 50.0% |
| Laotians | 98.4 /100 | #94 | Exceptional 49.9% |
| Immigrants | England | 98.0 /100 | #95 | Exceptional 49.7% |
| Romanians | 98.0 /100 | #96 | Exceptional 49.7% |
| Immigrants | Ukraine | 98.0 /100 | #97 | Exceptional 49.7% |
| Immigrants | Northern Africa | 97.9 /100 | #98 | Exceptional 49.7% |
| Macedonians | 97.8 /100 | #99 | Exceptional 49.6% |
| Immigrants | Nepal | 97.5 /100 | #100 | Exceptional 49.5% |
| Northern Europeans | 97.3 /100 | #101 | Exceptional 49.5% |
Demographics Similar to Immigrants from Peru by Associate's Degree
In terms of associate's degree, the demographic groups most similar to Immigrants from Peru are German (45.5%, a difference of 0.10%), French (45.4%, a difference of 0.19%), Immigrants from Cameroon (45.7%, a difference of 0.32%), Celtic (45.8%, a difference of 0.51%), and Scotch-Irish (45.3%, a difference of 0.54%).
| Demographics | Rating | Rank | Associate's Degree |
| Immigrants | Uruguay | 35.5 /100 | #187 | Fair 45.8% |
| Ghanaians | 35.5 /100 | #188 | Fair 45.8% |
| Immigrants | Oceania | 34.7 /100 | #189 | Fair 45.8% |
| Vietnamese | 34.0 /100 | #190 | Fair 45.8% |
| Koreans | 33.8 /100 | #191 | Fair 45.8% |
| Celtics | 33.3 /100 | #192 | Fair 45.8% |
| Immigrants | Cameroon | 31.0 /100 | #193 | Fair 45.7% |
| Immigrants | Peru | 27.6 /100 | #194 | Fair 45.5% |
| Germans | 26.5 /100 | #195 | Fair 45.5% |
| French | 25.6 /100 | #196 | Fair 45.4% |
| Scotch-Irish | 22.3 /100 | #197 | Fair 45.3% |
| Immigrants | Bangladesh | 21.3 /100 | #198 | Fair 45.2% |
| Immigrants | Senegal | 21.2 /100 | #199 | Fair 45.2% |
| Senegalese | 21.1 /100 | #200 | Fair 45.2% |
| Immigrants | Vietnam | 20.8 /100 | #201 | Fair 45.2% |