Turkish vs Immigrants from Sierra Leone Professional Degree
COMPARE
Turkish
Immigrants from Sierra Leone
Professional Degree
Professional Degree Comparison
Turks
Immigrants from Sierra Leone
6.2%
PROFESSIONAL DEGREE
100.0/ 100
METRIC RATING
28th/ 347
METRIC RANK
4.5%
PROFESSIONAL DEGREE
58.7/ 100
METRIC RATING
168th/ 347
METRIC RANK
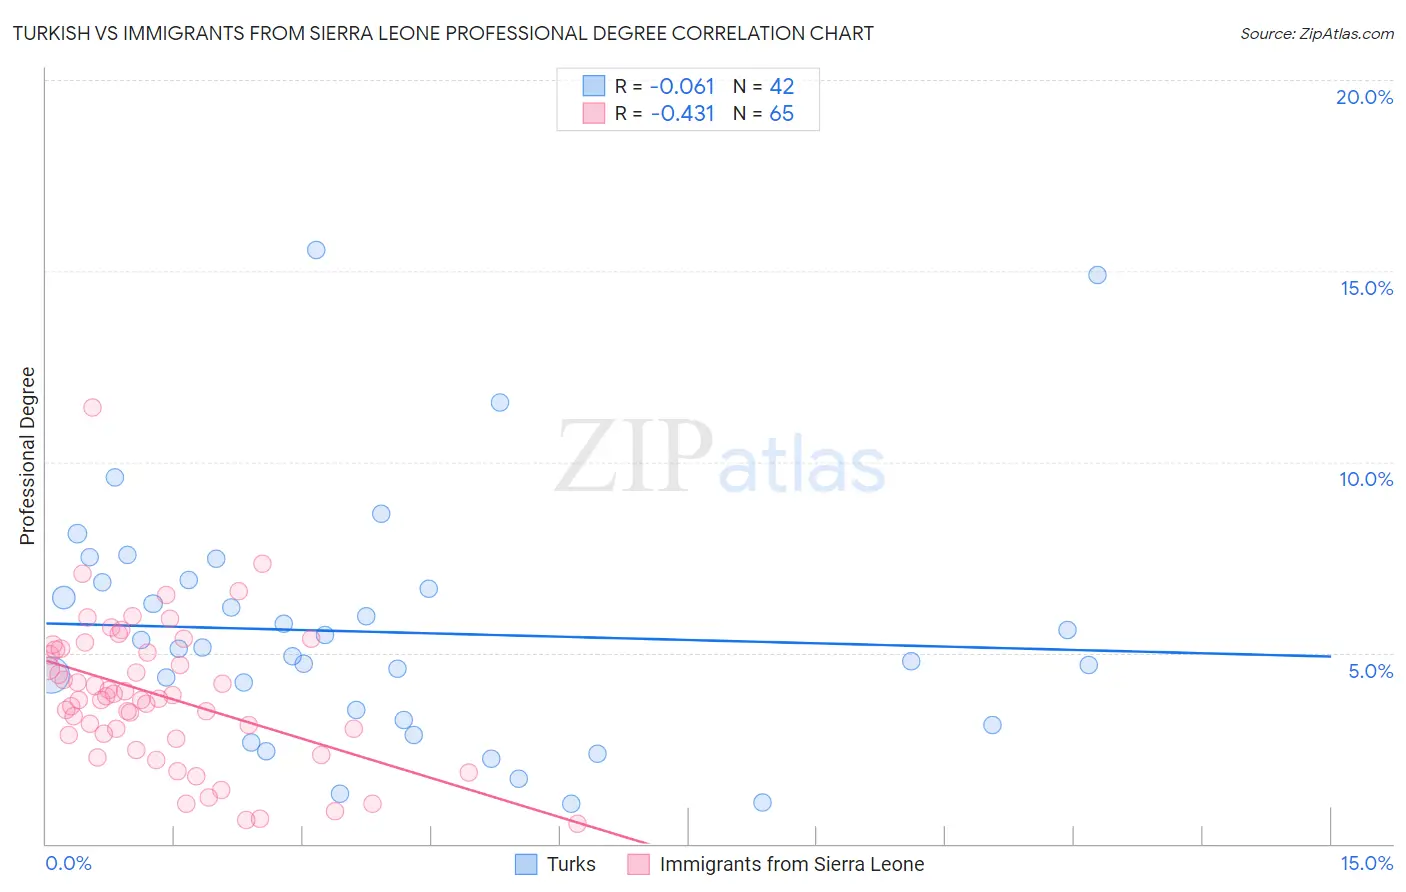
Turkish vs Immigrants from Sierra Leone Professional Degree Correlation Chart
The statistical analysis conducted on geographies consisting of 271,613,931 people shows a slight negative correlation between the proportion of Turks and percentage of population with at least professional degree education in the United States with a correlation coefficient (R) of -0.061 and weighted average of 6.2%. Similarly, the statistical analysis conducted on geographies consisting of 101,572,134 people shows a moderate negative correlation between the proportion of Immigrants from Sierra Leone and percentage of population with at least professional degree education in the United States with a correlation coefficient (R) of -0.431 and weighted average of 4.5%, a difference of 39.1%.
Professional Degree Correlation Summary
| Measurement | Turkish | Immigrants from Sierra Leone |
| Minimum | 1.0% | 0.52% |
| Maximum | 15.6% | 11.4% |
| Range | 14.5% | 10.9% |
| Mean | 5.5% | 3.9% |
| Median | 5.1% | 3.8% |
| Interquartile 25% (IQ1) | 3.3% | 2.8% |
| Interquartile 75% (IQ3) | 6.9% | 5.1% |
| Interquartile Range (IQR) | 3.6% | 2.3% |
| Standard Deviation (Sample) | 3.2% | 1.9% |
| Standard Deviation (Population) | 3.2% | 1.9% |
Similar Demographics by Professional Degree
Demographics Similar to Turks by Professional Degree
In terms of professional degree, the demographic groups most similar to Turks are Immigrants from Northern Europe (6.2%, a difference of 0.11%), Latvian (6.2%, a difference of 0.62%), Immigrants from Sri Lanka (6.2%, a difference of 0.63%), Immigrants from Turkey (6.2%, a difference of 0.63%), and Immigrants from India (6.2%, a difference of 0.75%).
| Demographics | Rating | Rank | Professional Degree |
| Immigrants | Hong Kong | 100.0 /100 | #21 | Exceptional 6.4% |
| Immigrants | Japan | 100.0 /100 | #22 | Exceptional 6.4% |
| Russians | 100.0 /100 | #23 | Exceptional 6.3% |
| Immigrants | Spain | 100.0 /100 | #24 | Exceptional 6.3% |
| Immigrants | Ireland | 100.0 /100 | #25 | Exceptional 6.3% |
| Latvians | 100.0 /100 | #26 | Exceptional 6.2% |
| Immigrants | Northern Europe | 100.0 /100 | #27 | Exceptional 6.2% |
| Turks | 100.0 /100 | #28 | Exceptional 6.2% |
| Immigrants | Sri Lanka | 100.0 /100 | #29 | Exceptional 6.2% |
| Immigrants | Turkey | 100.0 /100 | #30 | Exceptional 6.2% |
| Immigrants | India | 100.0 /100 | #31 | Exceptional 6.2% |
| Thais | 100.0 /100 | #32 | Exceptional 6.1% |
| Burmese | 100.0 /100 | #33 | Exceptional 6.1% |
| Mongolians | 100.0 /100 | #34 | Exceptional 6.1% |
| Immigrants | Korea | 100.0 /100 | #35 | Exceptional 6.1% |
Demographics Similar to Immigrants from Sierra Leone by Professional Degree
In terms of professional degree, the demographic groups most similar to Immigrants from Sierra Leone are Chinese (4.5%, a difference of 0.020%), Immigrants from Afghanistan (4.5%, a difference of 0.070%), Immigrants from Colombia (4.5%, a difference of 0.10%), Costa Rican (4.5%, a difference of 0.17%), and Immigrants from Zaire (4.5%, a difference of 0.19%).
| Demographics | Rating | Rank | Professional Degree |
| Assyrians/Chaldeans/Syriacs | 67.4 /100 | #161 | Good 4.5% |
| Peruvians | 65.2 /100 | #162 | Good 4.5% |
| Sierra Leoneans | 64.3 /100 | #163 | Good 4.5% |
| Swiss | 61.0 /100 | #164 | Good 4.5% |
| Costa Ricans | 59.9 /100 | #165 | Average 4.5% |
| Immigrants | Colombia | 59.4 /100 | #166 | Average 4.5% |
| Immigrants | Afghanistan | 59.2 /100 | #167 | Average 4.5% |
| Immigrants | Sierra Leone | 58.7 /100 | #168 | Average 4.5% |
| Chinese | 58.6 /100 | #169 | Average 4.5% |
| Immigrants | Zaire | 57.4 /100 | #170 | Average 4.5% |
| Immigrants | Bangladesh | 56.0 /100 | #171 | Average 4.4% |
| Spaniards | 52.0 /100 | #172 | Average 4.4% |
| English | 50.1 /100 | #173 | Average 4.4% |
| Kenyans | 50.0 /100 | #174 | Average 4.4% |
| Irish | 50.0 /100 | #175 | Average 4.4% |