Ukrainian vs Immigrants from Dominican Republic Professional Degree
COMPARE
Ukrainian
Immigrants from Dominican Republic
Professional Degree
Professional Degree Comparison
Ukrainians
Immigrants from Dominican Republic
5.1%
PROFESSIONAL DEGREE
98.5/ 100
METRIC RATING
102nd/ 347
METRIC RANK
3.4%
PROFESSIONAL DEGREE
0.2/ 100
METRIC RATING
301st/ 347
METRIC RANK
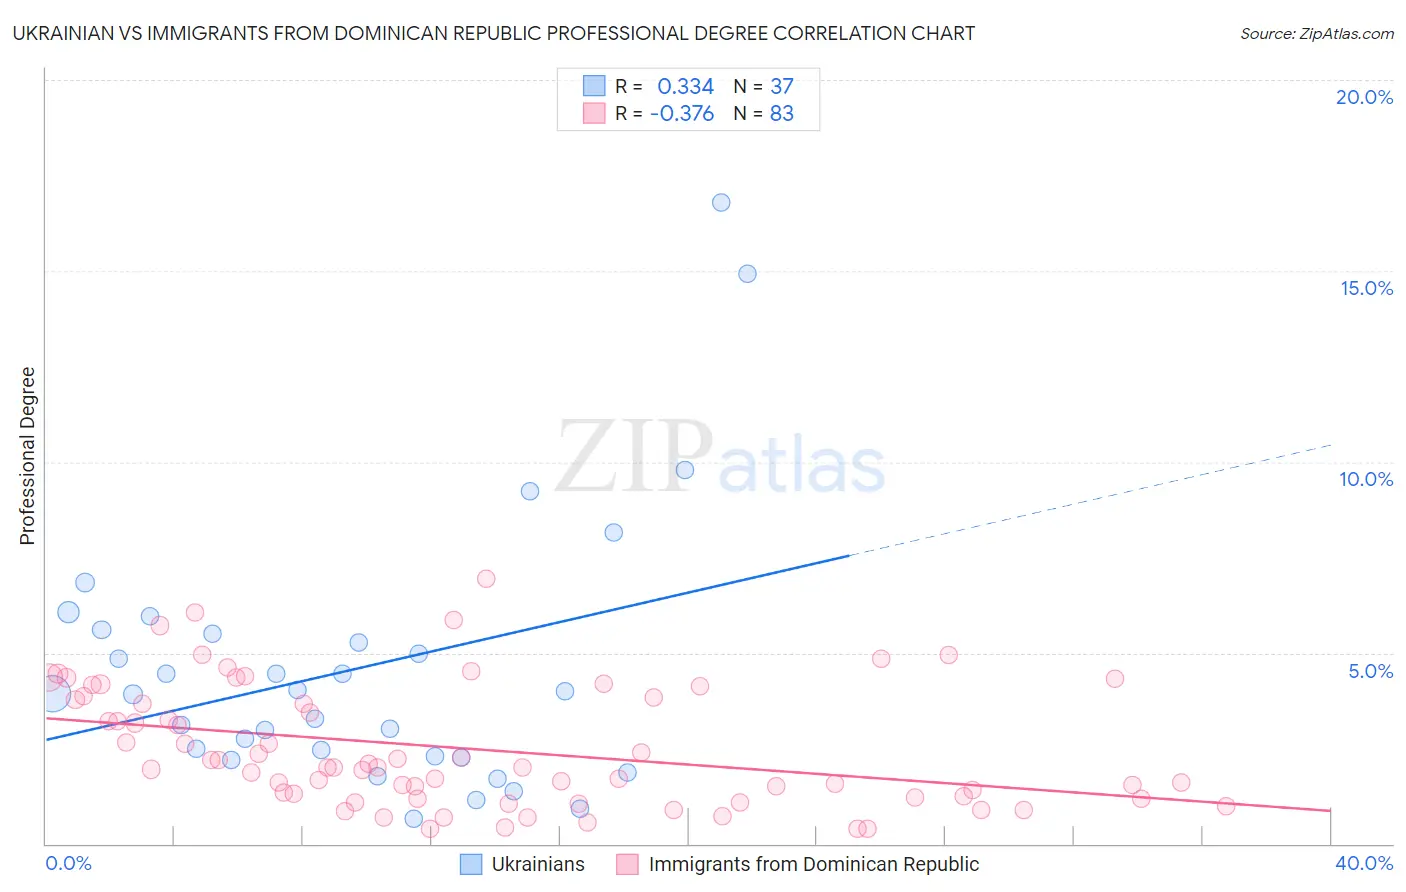
Ukrainian vs Immigrants from Dominican Republic Professional Degree Correlation Chart
The statistical analysis conducted on geographies consisting of 447,148,377 people shows a mild positive correlation between the proportion of Ukrainians and percentage of population with at least professional degree education in the United States with a correlation coefficient (R) of 0.334 and weighted average of 5.1%. Similarly, the statistical analysis conducted on geographies consisting of 274,641,839 people shows a mild negative correlation between the proportion of Immigrants from Dominican Republic and percentage of population with at least professional degree education in the United States with a correlation coefficient (R) of -0.376 and weighted average of 3.4%, a difference of 49.3%.
Professional Degree Correlation Summary
| Measurement | Ukrainian | Immigrants from Dominican Republic |
| Minimum | 0.66% | 0.38% |
| Maximum | 16.8% | 7.0% |
| Range | 16.1% | 6.6% |
| Mean | 4.6% | 2.5% |
| Median | 3.9% | 2.0% |
| Interquartile 25% (IQ1) | 2.3% | 1.2% |
| Interquartile 75% (IQ3) | 5.5% | 3.8% |
| Interquartile Range (IQR) | 3.3% | 2.6% |
| Standard Deviation (Sample) | 3.5% | 1.6% |
| Standard Deviation (Population) | 3.5% | 1.6% |
Similar Demographics by Professional Degree
Demographics Similar to Ukrainians by Professional Degree
In terms of professional degree, the demographic groups most similar to Ukrainians are Immigrants from Egypt (5.1%, a difference of 0.080%), Immigrants from Northern Africa (5.1%, a difference of 0.25%), Arab (5.0%, a difference of 0.56%), Immigrants from Uganda (5.0%, a difference of 0.59%), and Immigrants from Ukraine (5.0%, a difference of 0.62%).
| Demographics | Rating | Rank | Professional Degree |
| Zimbabweans | 99.3 /100 | #95 | Exceptional 5.2% |
| Immigrants | Uzbekistan | 99.2 /100 | #96 | Exceptional 5.2% |
| Syrians | 99.1 /100 | #97 | Exceptional 5.2% |
| Austrians | 99.1 /100 | #98 | Exceptional 5.2% |
| Immigrants | Italy | 99.1 /100 | #99 | Exceptional 5.2% |
| Ugandans | 98.8 /100 | #100 | Exceptional 5.1% |
| Immigrants | Egypt | 98.5 /100 | #101 | Exceptional 5.1% |
| Ukrainians | 98.5 /100 | #102 | Exceptional 5.1% |
| Immigrants | Northern Africa | 98.4 /100 | #103 | Exceptional 5.1% |
| Arabs | 98.2 /100 | #104 | Exceptional 5.0% |
| Immigrants | Uganda | 98.2 /100 | #105 | Exceptional 5.0% |
| Immigrants | Ukraine | 98.2 /100 | #106 | Exceptional 5.0% |
| Maltese | 98.1 /100 | #107 | Exceptional 5.0% |
| Immigrants | Southern Europe | 98.1 /100 | #108 | Exceptional 5.0% |
| British | 98.0 /100 | #109 | Exceptional 5.0% |
Demographics Similar to Immigrants from Dominican Republic by Professional Degree
In terms of professional degree, the demographic groups most similar to Immigrants from Dominican Republic are Malaysian (3.4%, a difference of 0.11%), Black/African American (3.4%, a difference of 0.14%), Immigrants from Yemen (3.4%, a difference of 0.28%), Immigrants from Haiti (3.4%, a difference of 0.76%), and Cajun (3.4%, a difference of 0.77%).
| Demographics | Rating | Rank | Professional Degree |
| Paiute | 0.3 /100 | #294 | Tragic 3.4% |
| Immigrants | Guatemala | 0.2 /100 | #295 | Tragic 3.4% |
| Hawaiians | 0.2 /100 | #296 | Tragic 3.4% |
| Immigrants | Liberia | 0.2 /100 | #297 | Tragic 3.4% |
| Ottawa | 0.2 /100 | #298 | Tragic 3.4% |
| Immigrants | Yemen | 0.2 /100 | #299 | Tragic 3.4% |
| Blacks/African Americans | 0.2 /100 | #300 | Tragic 3.4% |
| Immigrants | Dominican Republic | 0.2 /100 | #301 | Tragic 3.4% |
| Malaysians | 0.2 /100 | #302 | Tragic 3.4% |
| Immigrants | Haiti | 0.2 /100 | #303 | Tragic 3.4% |
| Cajuns | 0.2 /100 | #304 | Tragic 3.4% |
| Chickasaw | 0.1 /100 | #305 | Tragic 3.4% |
| Cape Verdeans | 0.1 /100 | #306 | Tragic 3.4% |
| Samoans | 0.1 /100 | #307 | Tragic 3.3% |
| Shoshone | 0.1 /100 | #308 | Tragic 3.3% |