Australian vs Immigrants from Dominican Republic Professional Degree
COMPARE
Australian
Immigrants from Dominican Republic
Professional Degree
Professional Degree Comparison
Australians
Immigrants from Dominican Republic
5.9%
PROFESSIONAL DEGREE
100.0/ 100
METRIC RATING
47th/ 347
METRIC RANK
3.4%
PROFESSIONAL DEGREE
0.2/ 100
METRIC RATING
301st/ 347
METRIC RANK
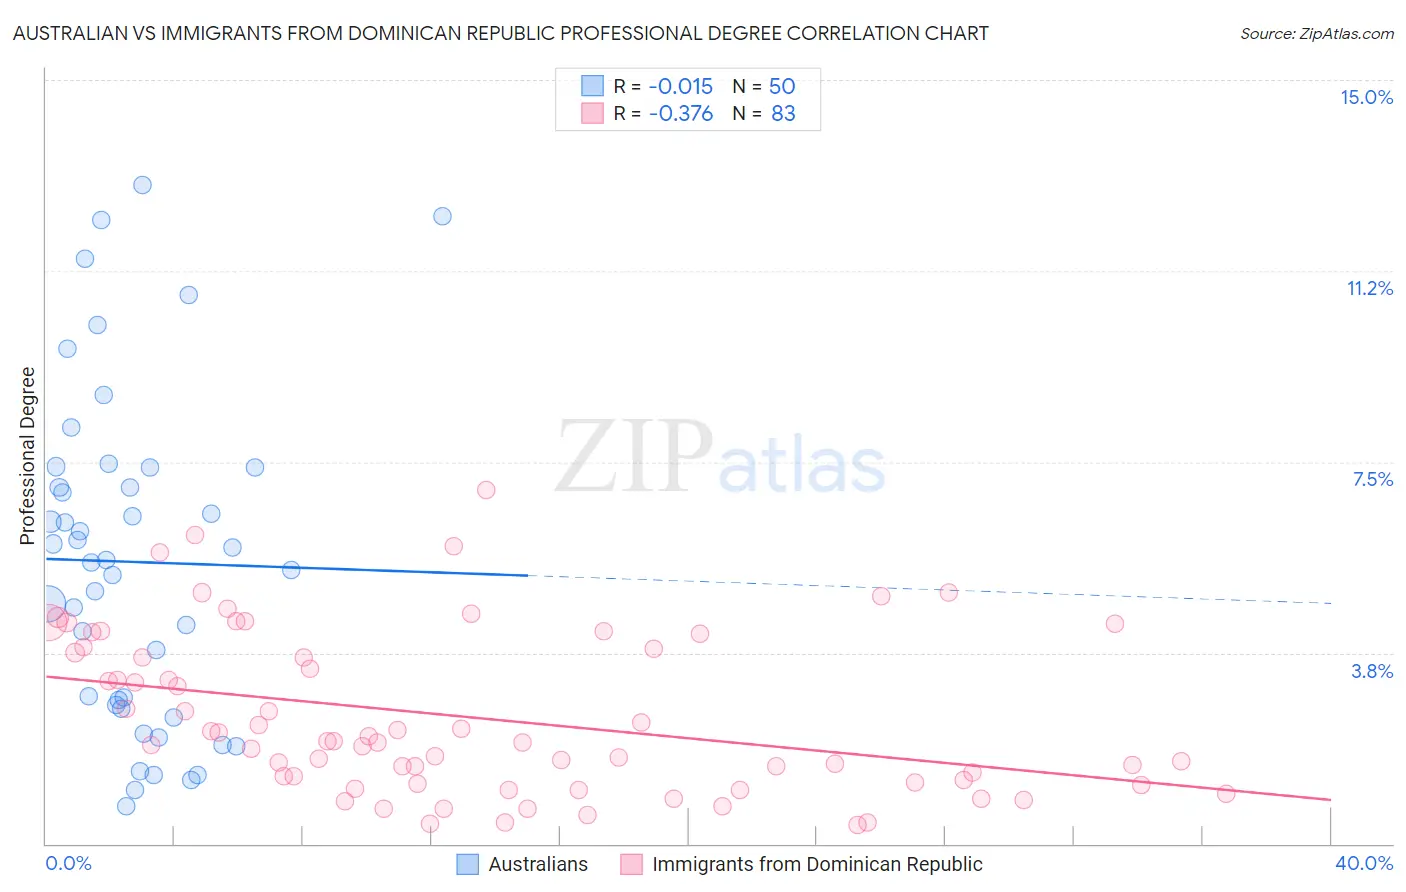
Australian vs Immigrants from Dominican Republic Professional Degree Correlation Chart
The statistical analysis conducted on geographies consisting of 223,901,125 people shows no correlation between the proportion of Australians and percentage of population with at least professional degree education in the United States with a correlation coefficient (R) of -0.015 and weighted average of 5.9%. Similarly, the statistical analysis conducted on geographies consisting of 274,641,839 people shows a mild negative correlation between the proportion of Immigrants from Dominican Republic and percentage of population with at least professional degree education in the United States with a correlation coefficient (R) of -0.376 and weighted average of 3.4%, a difference of 73.3%.
Professional Degree Correlation Summary
| Measurement | Australian | Immigrants from Dominican Republic |
| Minimum | 0.73% | 0.38% |
| Maximum | 12.9% | 7.0% |
| Range | 12.2% | 6.6% |
| Mean | 5.5% | 2.5% |
| Median | 5.5% | 2.0% |
| Interquartile 25% (IQ1) | 2.7% | 1.2% |
| Interquartile 75% (IQ3) | 7.4% | 3.8% |
| Interquartile Range (IQR) | 4.7% | 2.6% |
| Standard Deviation (Sample) | 3.2% | 1.6% |
| Standard Deviation (Population) | 3.2% | 1.6% |
Similar Demographics by Professional Degree
Demographics Similar to Australians by Professional Degree
In terms of professional degree, the demographic groups most similar to Australians are Immigrants from Argentina (5.9%, a difference of 0.010%), Immigrants from South Central Asia (5.9%, a difference of 0.22%), Paraguayan (5.9%, a difference of 0.42%), Argentinean (5.9%, a difference of 0.66%), and Immigrants from Saudi Arabia (5.9%, a difference of 0.82%).
| Demographics | Rating | Rank | Professional Degree |
| Cambodians | 100.0 /100 | #40 | Exceptional 6.0% |
| New Zealanders | 100.0 /100 | #41 | Exceptional 6.0% |
| Estonians | 100.0 /100 | #42 | Exceptional 6.0% |
| Immigrants | Saudi Arabia | 100.0 /100 | #43 | Exceptional 5.9% |
| Argentineans | 100.0 /100 | #44 | Exceptional 5.9% |
| Immigrants | South Central Asia | 100.0 /100 | #45 | Exceptional 5.9% |
| Immigrants | Argentina | 100.0 /100 | #46 | Exceptional 5.9% |
| Australians | 100.0 /100 | #47 | Exceptional 5.9% |
| Paraguayans | 100.0 /100 | #48 | Exceptional 5.9% |
| Immigrants | Latvia | 100.0 /100 | #49 | Exceptional 5.8% |
| Immigrants | Czechoslovakia | 100.0 /100 | #50 | Exceptional 5.8% |
| Immigrants | Greece | 100.0 /100 | #51 | Exceptional 5.8% |
| Immigrants | Serbia | 100.0 /100 | #52 | Exceptional 5.8% |
| Immigrants | Netherlands | 100.0 /100 | #53 | Exceptional 5.8% |
| Immigrants | Kuwait | 100.0 /100 | #54 | Exceptional 5.7% |
Demographics Similar to Immigrants from Dominican Republic by Professional Degree
In terms of professional degree, the demographic groups most similar to Immigrants from Dominican Republic are Malaysian (3.4%, a difference of 0.11%), Black/African American (3.4%, a difference of 0.14%), Immigrants from Yemen (3.4%, a difference of 0.28%), Immigrants from Haiti (3.4%, a difference of 0.76%), and Cajun (3.4%, a difference of 0.77%).
| Demographics | Rating | Rank | Professional Degree |
| Paiute | 0.3 /100 | #294 | Tragic 3.4% |
| Immigrants | Guatemala | 0.2 /100 | #295 | Tragic 3.4% |
| Hawaiians | 0.2 /100 | #296 | Tragic 3.4% |
| Immigrants | Liberia | 0.2 /100 | #297 | Tragic 3.4% |
| Ottawa | 0.2 /100 | #298 | Tragic 3.4% |
| Immigrants | Yemen | 0.2 /100 | #299 | Tragic 3.4% |
| Blacks/African Americans | 0.2 /100 | #300 | Tragic 3.4% |
| Immigrants | Dominican Republic | 0.2 /100 | #301 | Tragic 3.4% |
| Malaysians | 0.2 /100 | #302 | Tragic 3.4% |
| Immigrants | Haiti | 0.2 /100 | #303 | Tragic 3.4% |
| Cajuns | 0.2 /100 | #304 | Tragic 3.4% |
| Chickasaw | 0.1 /100 | #305 | Tragic 3.4% |
| Cape Verdeans | 0.1 /100 | #306 | Tragic 3.4% |
| Samoans | 0.1 /100 | #307 | Tragic 3.3% |
| Shoshone | 0.1 /100 | #308 | Tragic 3.3% |