Turkish vs Immigrants from Eastern Europe Professional Degree

COMPARE

Turkish
Race
Ancestry
AfghanAfricanAlaska NativeAlaskan AthabascanAlbanianAleutAlsatianAmericanApacheArabArapahoArgentineanArmenianAssyrian/Chaldean/SyriacAustralianAustrianBahamianBangladeshiBarbadianBasqueBelgianBelizeanBermudanBhutaneseBlackfeetBolivianBrazilianBritishBritish West IndianBulgarianBurmeseCajunCambodianCanadianCape VerdeanCarpatho RusynCelticCentral AmericanCentral American IndianCherokeeCheyenneChickasawChileanChineseChippewaChoctawColombianColvilleComancheCosta RicanCreeCreekCroatianCrowCubanCypriotCzechCzechoslovakianDanishDelawareDominicanDutchDutch West IndianEastern EuropeanEcuadorianEgyptianEnglishEstonianEthiopianEuropeanFijianFilipinoFinnishFrenchFrench American IndianFrench CanadianGermanGerman RussianGhanaianGreekGuamanian/ChamorroGuatemalanGuyaneseHaitianHmongHonduranHopiHoumaHungarianIcelanderIndian (Asian)IndonesianInupiatIranianIraqiIrishIroquoisIsraeliItalianJamaicanJapaneseJordanianKenyanKiowaKoreanLaotianLatvianLebaneseLiberianLithuanianLumbeeLuxembourgerMacedonianMalaysianMalteseMarshalleseMenomineeMexicanMexican American IndianMongolianMoroccanNative HawaiianNavajoNepaleseNew ZealanderNicaraguanNigerianNorthern EuropeanNorwegianOkinawanOsageOttawaPaiutePakistaniPalestinianPanamanianParaguayanPennsylvania GermanPeruvianPimaPolishPortuguesePotawatomiPuebloPuerto RicanPuget Sound SalishRomanianRussianSalvadoranSamoanScandinavianScotch-IrishScottishSeminoleSenegaleseSerbianShoshoneSierra LeoneanSiouxSlavicSlovakSloveneSomaliSouth AfricanSouth AmericanSouth American IndianSoviet UnionSpaniardSpanishSpanish AmericanSpanish American IndianSri LankanSubsaharan AfricanSudaneseSwedishSwissSyrianTaiwaneseThaiTlingit-HaidaTohono O'OdhamTonganTrinidadian and TobagonianTsimshianTurkishU.S. Virgin IslanderUgandanUkrainianUruguayanUteVenezuelanVietnameseWelshWest IndianYakamaYaquiYugoslavianYumanYup'ikZimbabwean
Immigration
NonimmigrantsImmigrantsAfghanistanAfricaAlbaniaArgentinaArmeniaAsiaAustraliaAustriaBahamasBangladeshBarbadosBelarusBelgiumBelizeBoliviaBosnia and HerzegovinaBrazilBulgariaBurma/MyanmarCabo VerdeCambodiaCameroonCanadaCaribbeanCentral AmericaChileChinaColombiaCongoCosta RicaCroatiaCubaCzechoslovakiaDenmarkDominicaDominican RepublicEastern AfricaEastern AsiaEcuadorEgyptEl SalvadorEnglandEritreaEthiopiaEuropeFijiFranceGermanyGhanaGreeceGrenadaGuatemalaGuyanaHaitiHondurasHong KongHungaryIndiaIndonesiaIranIraqIrelandIsraelItalyJamaicaJapanJordanKazakhstanKenyaKoreaKuwaitLaosLatin AmericaLatviaLebanonLiberiaLithuaniaMalaysiaMexicoMicronesiaMiddle AfricaMoldovaMoroccoNepalNetherlandsNicaraguaNigeriaNorth AmericaNorth MacedoniaNorthern AfricaNorthern EuropeNorwayOceaniaPakistanPanamaPeruPhilippinesPolandPortugalRomaniaRussiaSaudi ArabiaScotlandSenegalSerbiaSierra LeoneSingaporeSomaliaSouth AfricaSouth AmericaSouth Central AsiaSouth Eastern AsiaSouthern EuropeSpainSri LankaSt. Vincent and the GrenadinesSudanSwedenSwitzerlandSyriaTaiwanThailandTrinidad and TobagoTurkeyUgandaUkraineUruguayUzbekistanVenezuelaVietnamWest IndiesWestern AfricaWestern AsiaWestern EuropeYemenZaireZimbabweAzores
Immigrants from Eastern Europe
Race
Ancestry
AfghanAfricanAlaska NativeAlaskan AthabascanAlbanianAleutAlsatianAmericanApacheArabArapahoArgentineanArmenianAssyrian/Chaldean/SyriacAustralianAustrianBahamianBangladeshiBarbadianBasqueBelgianBelizeanBermudanBhutaneseBlackfeetBolivianBrazilianBritishBritish West IndianBulgarianBurmeseCajunCambodianCanadianCape VerdeanCarpatho RusynCelticCentral AmericanCentral American IndianCherokeeCheyenneChickasawChileanChineseChippewaChoctawColombianColvilleComancheCosta RicanCreeCreekCroatianCrowCubanCypriotCzechCzechoslovakianDanishDelawareDominicanDutchDutch West IndianEastern EuropeanEcuadorianEgyptianEnglishEstonianEthiopianEuropeanFijianFilipinoFinnishFrenchFrench American IndianFrench CanadianGermanGerman RussianGhanaianGreekGuamanian/ChamorroGuatemalanGuyaneseHaitianHmongHonduranHopiHoumaHungarianIcelanderIndian (Asian)IndonesianInupiatIranianIraqiIrishIroquoisIsraeliItalianJamaicanJapaneseJordanianKenyanKiowaKoreanLaotianLatvianLebaneseLiberianLithuanianLumbeeLuxembourgerMacedonianMalaysianMalteseMarshalleseMenomineeMexicanMexican American IndianMongolianMoroccanNative HawaiianNavajoNepaleseNew ZealanderNicaraguanNigerianNorthern EuropeanNorwegianOkinawanOsageOttawaPaiutePakistaniPalestinianPanamanianParaguayanPennsylvania GermanPeruvianPimaPolishPortuguesePotawatomiPuebloPuerto RicanPuget Sound SalishRomanianRussianSalvadoranSamoanScandinavianScotch-IrishScottishSeminoleSenegaleseSerbianShoshoneSierra LeoneanSiouxSlavicSlovakSloveneSomaliSouth AfricanSouth AmericanSouth American IndianSoviet UnionSpaniardSpanishSpanish AmericanSpanish American IndianSri LankanSubsaharan AfricanSudaneseSwedishSwissSyrianTaiwaneseThaiTlingit-HaidaTohono O'OdhamTonganTrinidadian and TobagonianTsimshianU.S. Virgin IslanderUgandanUkrainianUruguayanUteVenezuelanVietnameseWelshWest IndianYakamaYaquiYugoslavianYumanYup'ikZimbabwean
Immigration
NonimmigrantsImmigrantsAfghanistanAfricaAlbaniaArgentinaArmeniaAsiaAustraliaAustriaBahamasBangladeshBarbadosBelarusBelgiumBelizeBoliviaBosnia and HerzegovinaBrazilBulgariaBurma/MyanmarCabo VerdeCambodiaCameroonCanadaCaribbeanCentral AmericaChileChinaColombiaCongoCosta RicaCroatiaCubaCzechoslovakiaDenmarkDominicaDominican RepublicEastern AfricaEastern AsiaEastern EuropeEcuadorEgyptEl SalvadorEnglandEritreaEthiopiaEuropeFijiFranceGermanyGhanaGreeceGrenadaGuatemalaGuyanaHaitiHondurasHong KongHungaryIndiaIndonesiaIranIraqIrelandIsraelItalyJamaicaJapanJordanKazakhstanKenyaKoreaKuwaitLaosLatin AmericaLatviaLebanonLiberiaLithuaniaMalaysiaMexicoMicronesiaMiddle AfricaMoldovaMoroccoNepalNetherlandsNicaraguaNigeriaNorth AmericaNorth MacedoniaNorthern AfricaNorthern EuropeNorwayOceaniaPakistanPanamaPeruPhilippinesPolandPortugalRomaniaRussiaSaudi ArabiaScotlandSenegalSerbiaSierra LeoneSingaporeSomaliaSouth AfricaSouth AmericaSouth Central AsiaSouth Eastern AsiaSouthern EuropeSpainSri LankaSt. Vincent and the GrenadinesSudanSwedenSwitzerlandSyriaTaiwanThailandTrinidad and TobagoTurkeyUgandaUkraineUruguayUzbekistanVenezuelaVietnamWest IndiesWestern AfricaWestern AsiaWestern EuropeYemenZaireZimbabweAzores
Professional Degree
Income
Poverty
Unemployment
Labor Participation
Family Structure
Vehicle Availability
Education Level
Disability

Professional Degree Comparison

Turks

Immigrants from Eastern Europe

Exceptional
Exceptional
6.2%
PROFESSIONAL DEGREE
100.0/ 100
METRIC RATING
28th/ 347
METRIC RANK
5.2%
PROFESSIONAL DEGREE
99.5/ 100
METRIC RATING
92nd/ 347
METRIC RANK

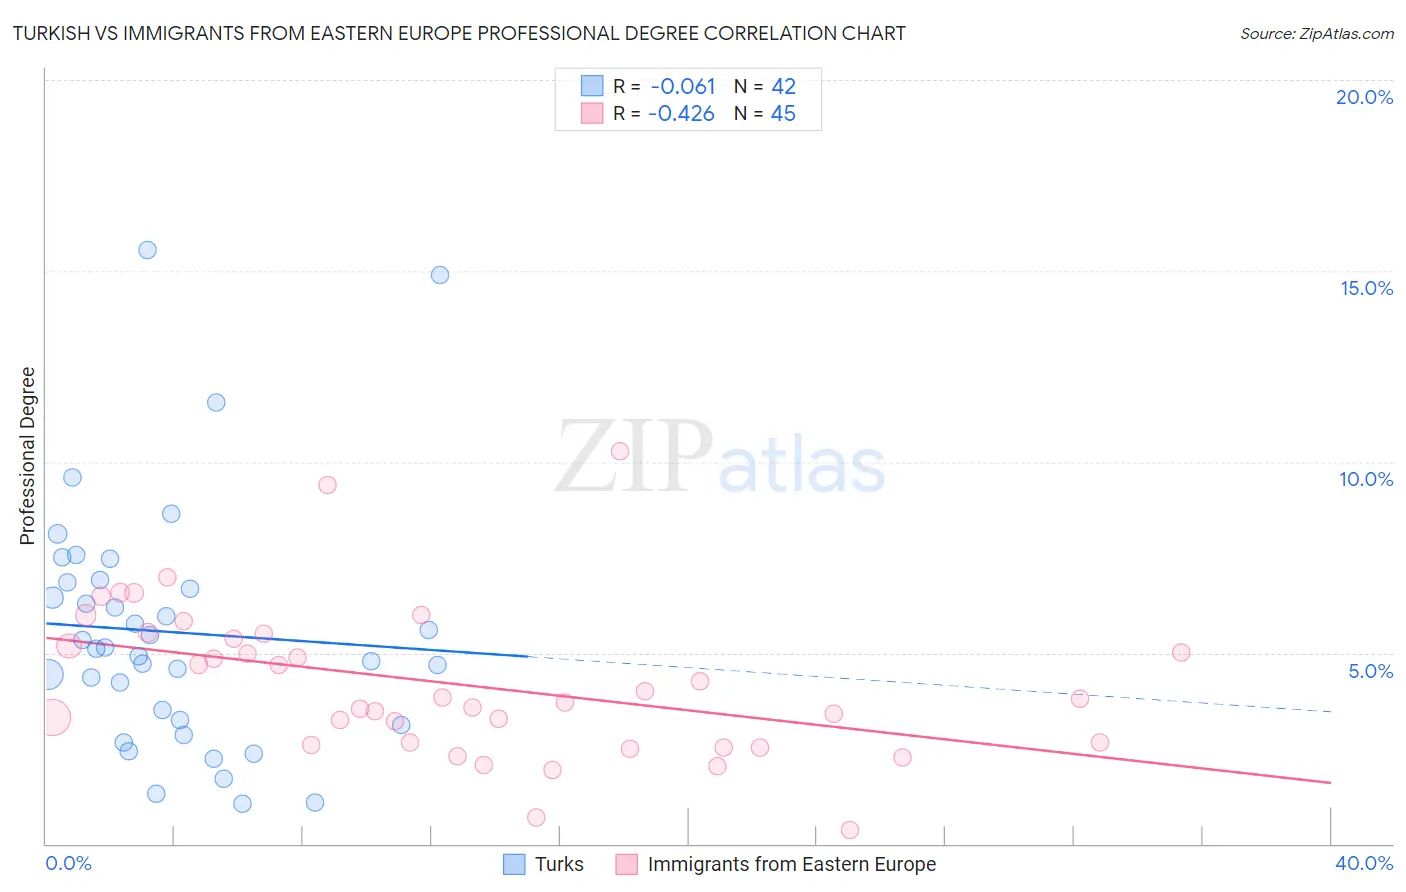
Turkish vs Immigrants from Eastern Europe Professional Degree Correlation Chart

The statistical analysis conducted on geographies consisting of 271,613,931 people shows a slight negative correlation between the proportion of Turks and percentage of population with at least professional degree education in the United States with a correlation coefficient (R) of -0.061 and weighted average of 6.2%. Similarly, the statistical analysis conducted on geographies consisting of 474,383,803 people shows a moderate negative correlation between the proportion of Immigrants from Eastern Europe and percentage of population with at least professional degree education in the United States with a correlation coefficient (R) of -0.426 and weighted average of 5.2%, a difference of 18.4%.
Turkish vs Immigrants from Eastern Europe Professional Degree

Professional Degree Correlation Summary

MeasurementTurkishImmigrants from Eastern Europe
Minimum1.0%0.35%
Maximum15.6%10.3%
Range14.5%9.9%
Mean5.5%4.2%
Median5.1%3.8%
Interquartile 25% (IQ1)3.3%2.6%
Interquartile 75% (IQ3)6.9%5.4%
Interquartile Range (IQR)3.6%2.8%
Standard Deviation (Sample)3.2%2.0%
Standard Deviation (Population)3.2%2.0%

Similar Demographics by Professional Degree

Demographics Similar to Turks by Professional Degree

In terms of professional degree, the demographic groups most similar to Turks are Immigrants from Northern Europe (6.2%, a difference of 0.11%), Latvian (6.2%, a difference of 0.62%), Immigrants from Sri Lanka (6.2%, a difference of 0.63%), Immigrants from Turkey (6.2%, a difference of 0.63%), and Immigrants from India (6.2%, a difference of 0.75%).
DemographicsRating | RankProfessional Degree
Immigrants | Hong Kong
100.0
/100
|
#21
Exceptional
6.4%
Immigrants | Japan
100.0
/100
|
#22
Exceptional
6.4%
Russians
100.0
/100
|
#23
Exceptional
6.3%
Immigrants | Spain
100.0
/100
|
#24
Exceptional
6.3%
Immigrants | Ireland
100.0
/100
|
#25
Exceptional
6.3%
Latvians
100.0
/100
|
#26
Exceptional
6.2%
Immigrants | Northern Europe
100.0
/100
|
#27
Exceptional
6.2%
Turks
100.0
/100
|
#28
Exceptional
6.2%
Immigrants | Sri Lanka
100.0
/100
|
#29
Exceptional
6.2%
Immigrants | Turkey
100.0
/100
|
#30
Exceptional
6.2%
Immigrants | India
100.0
/100
|
#31
Exceptional
6.2%
Thais
100.0
/100
|
#32
Exceptional
6.1%
Burmese
100.0
/100
|
#33
Exceptional
6.1%
Mongolians
100.0
/100
|
#34
Exceptional
6.1%
Immigrants | Korea
100.0
/100
|
#35
Exceptional
6.1%

Demographics Similar to Immigrants from Eastern Europe by Professional Degree

In terms of professional degree, the demographic groups most similar to Immigrants from Eastern Europe are Laotian (5.2%, a difference of 0.040%), Immigrants from Scotland (5.3%, a difference of 0.20%), Egyptian (5.3%, a difference of 0.30%), Chilean (5.3%, a difference of 0.30%), and Immigrants from Chile (5.3%, a difference of 0.44%).
DemographicsRating | RankProfessional Degree
Immigrants | Zimbabwe
99.6
/100
|
#85
Exceptional
5.3%
Greeks
99.6
/100
|
#86
Exceptional
5.3%
Immigrants | Chile
99.5
/100
|
#87
Exceptional
5.3%
Egyptians
99.5
/100
|
#88
Exceptional
5.3%
Chileans
99.5
/100
|
#89
Exceptional
5.3%
Immigrants | Scotland
99.5
/100
|
#90
Exceptional
5.3%
Laotians
99.5
/100
|
#91
Exceptional
5.2%
Immigrants | Eastern Europe
99.5
/100
|
#92
Exceptional
5.2%
Northern Europeans
99.3
/100
|
#93
Exceptional
5.2%
Alsatians
99.3
/100
|
#94
Exceptional
5.2%
Zimbabweans
99.3
/100
|
#95
Exceptional
5.2%
Immigrants | Uzbekistan
99.2
/100
|
#96
Exceptional
5.2%
Syrians
99.1
/100
|
#97
Exceptional
5.2%
Austrians
99.1
/100
|
#98
Exceptional
5.2%
Immigrants | Italy
99.1
/100
|
#99
Exceptional
5.2%