Immigrants from Caribbean vs Immigrants from Dominican Republic Professional Degree
COMPARE
Immigrants from Caribbean
Immigrants from Dominican Republic
Professional Degree
Professional Degree Comparison
Immigrants from Caribbean
Immigrants from Dominican Republic
3.5%
PROFESSIONAL DEGREE
0.5/ 100
METRIC RATING
282nd/ 347
METRIC RANK
3.4%
PROFESSIONAL DEGREE
0.2/ 100
METRIC RATING
301st/ 347
METRIC RANK
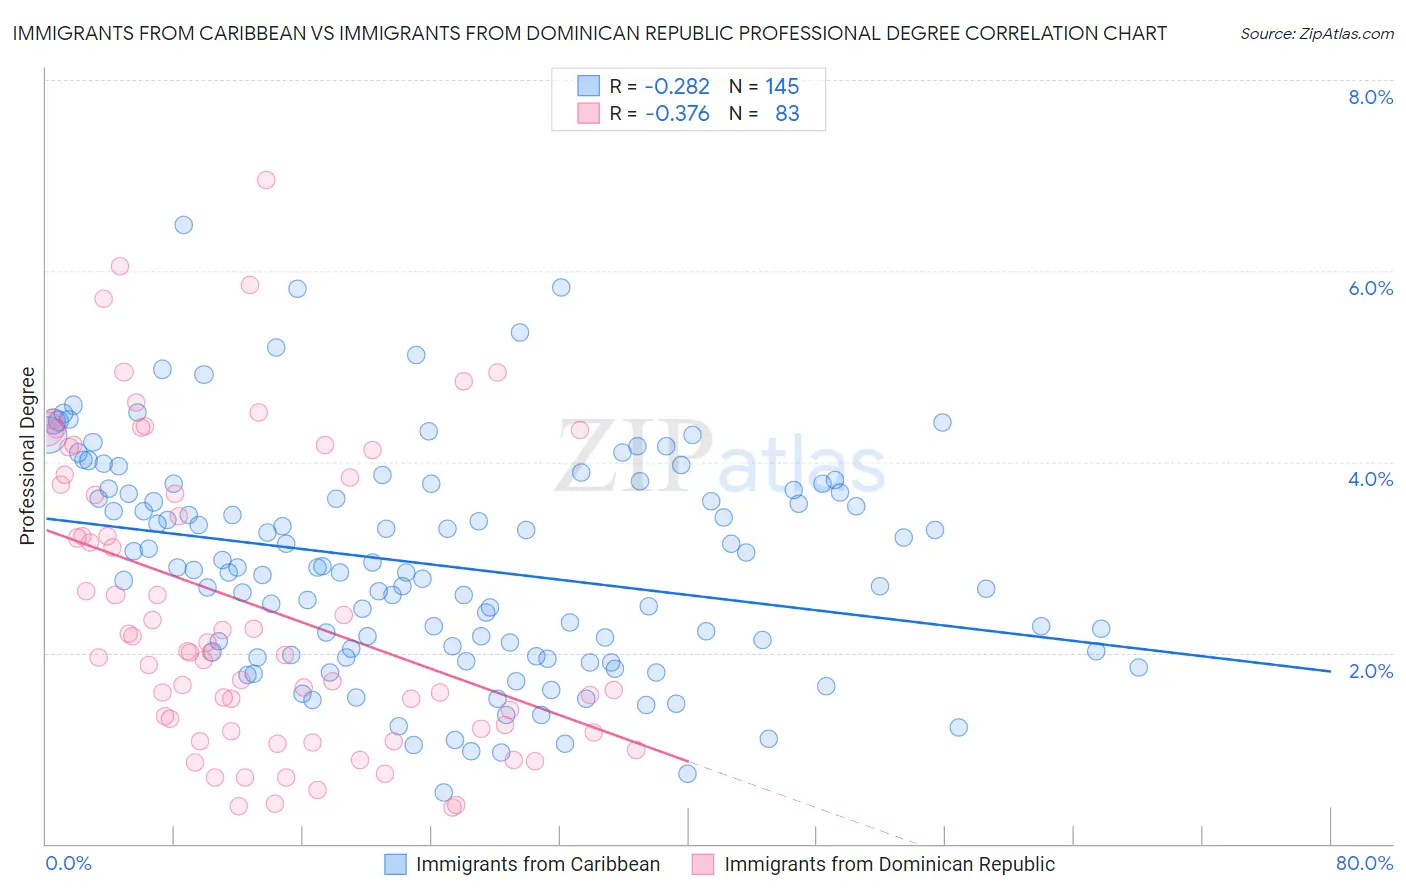
Immigrants from Caribbean vs Immigrants from Dominican Republic Professional Degree Correlation Chart
The statistical analysis conducted on geographies consisting of 448,523,190 people shows a weak negative correlation between the proportion of Immigrants from Caribbean and percentage of population with at least professional degree education in the United States with a correlation coefficient (R) of -0.282 and weighted average of 3.5%. Similarly, the statistical analysis conducted on geographies consisting of 274,641,839 people shows a mild negative correlation between the proportion of Immigrants from Dominican Republic and percentage of population with at least professional degree education in the United States with a correlation coefficient (R) of -0.376 and weighted average of 3.4%, a difference of 4.3%.
Professional Degree Correlation Summary
| Measurement | Immigrants from Caribbean | Immigrants from Dominican Republic |
| Minimum | 0.54% | 0.38% |
| Maximum | 6.5% | 7.0% |
| Range | 5.9% | 6.6% |
| Mean | 2.9% | 2.5% |
| Median | 2.9% | 2.0% |
| Interquartile 25% (IQ1) | 2.0% | 1.2% |
| Interquartile 75% (IQ3) | 3.7% | 3.8% |
| Interquartile Range (IQR) | 1.7% | 2.6% |
| Standard Deviation (Sample) | 1.2% | 1.6% |
| Standard Deviation (Population) | 1.1% | 1.6% |
Demographics Similar to Immigrants from Caribbean and Immigrants from Dominican Republic by Professional Degree
In terms of professional degree, the demographic groups most similar to Immigrants from Caribbean are Apache (3.5%, a difference of 0.020%), Comanche (3.5%, a difference of 0.30%), Salvadoran (3.5%, a difference of 0.40%), Honduran (3.5%, a difference of 1.5%), and Haitian (3.5%, a difference of 1.8%). Similarly, the demographic groups most similar to Immigrants from Dominican Republic are Black/African American (3.4%, a difference of 0.14%), Immigrants from Yemen (3.4%, a difference of 0.28%), Ottawa (3.4%, a difference of 0.95%), Immigrants from Liberia (3.4%, a difference of 1.0%), and Hawaiian (3.4%, a difference of 1.3%).
| Demographics | Rating | Rank | Professional Degree |
| Apache | 0.5 /100 | #281 | Tragic 3.5% |
| Immigrants | Caribbean | 0.5 /100 | #282 | Tragic 3.5% |
| Comanche | 0.4 /100 | #283 | Tragic 3.5% |
| Salvadorans | 0.4 /100 | #284 | Tragic 3.5% |
| Hondurans | 0.3 /100 | #285 | Tragic 3.5% |
| Haitians | 0.3 /100 | #286 | Tragic 3.5% |
| Immigrants | El Salvador | 0.3 /100 | #287 | Tragic 3.5% |
| Blackfeet | 0.3 /100 | #288 | Tragic 3.5% |
| Guatemalans | 0.3 /100 | #289 | Tragic 3.5% |
| Chippewa | 0.3 /100 | #290 | Tragic 3.5% |
| Alaska Natives | 0.3 /100 | #291 | Tragic 3.5% |
| Immigrants | Belize | 0.3 /100 | #292 | Tragic 3.5% |
| Immigrants | Honduras | 0.3 /100 | #293 | Tragic 3.5% |
| Paiute | 0.3 /100 | #294 | Tragic 3.4% |
| Immigrants | Guatemala | 0.2 /100 | #295 | Tragic 3.4% |
| Hawaiians | 0.2 /100 | #296 | Tragic 3.4% |
| Immigrants | Liberia | 0.2 /100 | #297 | Tragic 3.4% |
| Ottawa | 0.2 /100 | #298 | Tragic 3.4% |
| Immigrants | Yemen | 0.2 /100 | #299 | Tragic 3.4% |
| Blacks/African Americans | 0.2 /100 | #300 | Tragic 3.4% |
| Immigrants | Dominican Republic | 0.2 /100 | #301 | Tragic 3.4% |