Tsimshian vs Indian (Asian) No Schooling Completed
COMPARE
Tsimshian
Indian (Asian)
No Schooling Completed
No Schooling Completed Comparison
Tsimshian
Indians (Asian)
1.7%
NO SCHOOLING COMPLETED
99.8/ 100
METRIC RATING
61st/ 347
METRIC RANK
2.5%
NO SCHOOLING COMPLETED
0.4/ 100
METRIC RATING
264th/ 347
METRIC RANK
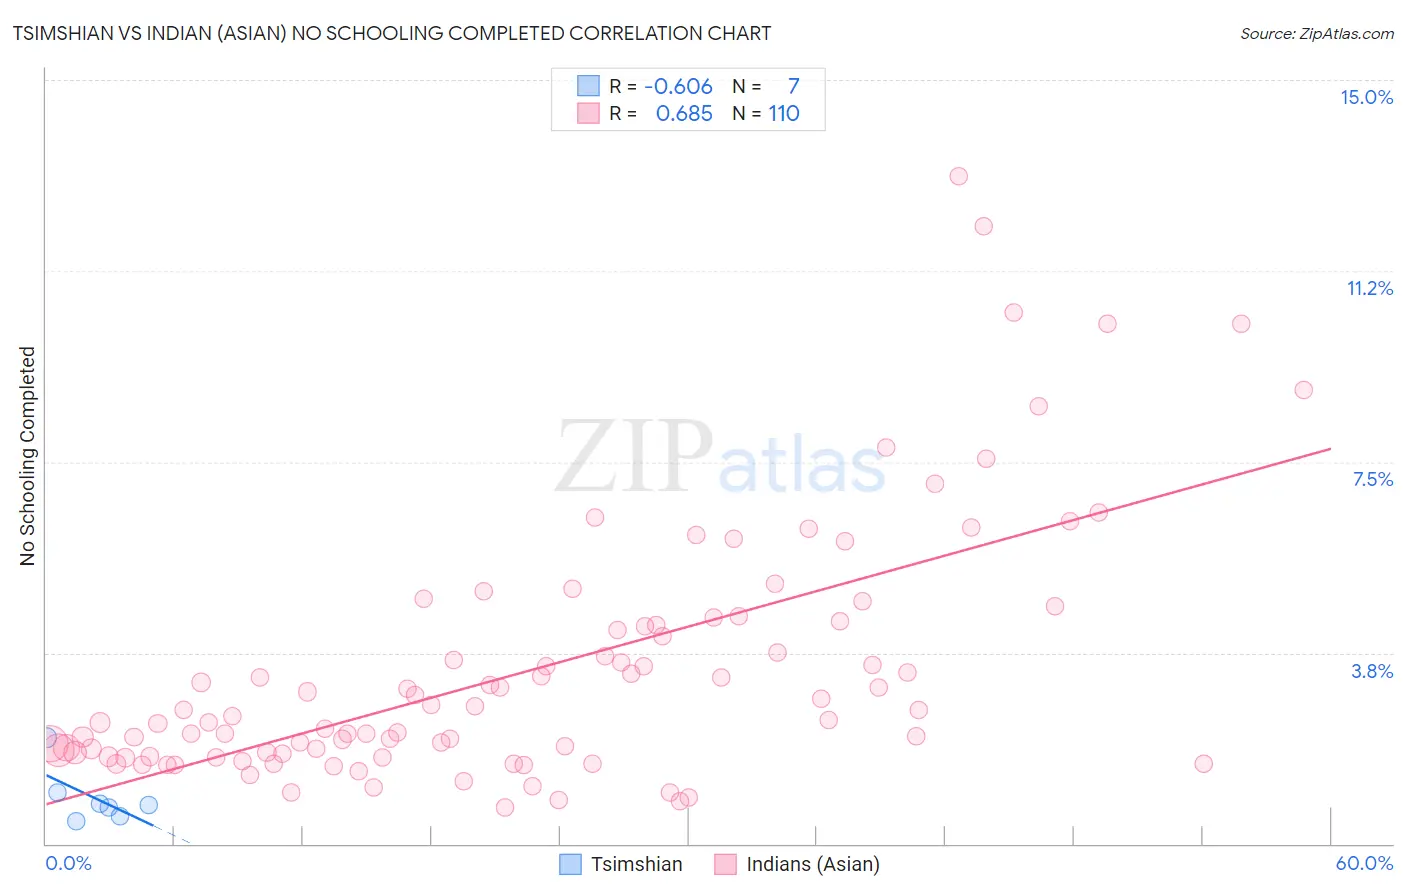
Tsimshian vs Indian (Asian) No Schooling Completed Correlation Chart
The statistical analysis conducted on geographies consisting of 15,573,780 people shows a significant negative correlation between the proportion of Tsimshian and percentage of population with no schooling in the United States with a correlation coefficient (R) of -0.606 and weighted average of 1.7%. Similarly, the statistical analysis conducted on geographies consisting of 487,020,053 people shows a significant positive correlation between the proportion of Indians (Asian) and percentage of population with no schooling in the United States with a correlation coefficient (R) of 0.685 and weighted average of 2.5%, a difference of 49.3%.
No Schooling Completed Correlation Summary
| Measurement | Tsimshian | Indian (Asian) |
| Minimum | 0.44% | 0.70% |
| Maximum | 2.1% | 13.1% |
| Range | 1.6% | 12.4% |
| Mean | 0.90% | 3.4% |
| Median | 0.76% | 2.6% |
| Interquartile 25% (IQ1) | 0.55% | 1.8% |
| Interquartile 75% (IQ3) | 1.00% | 4.3% |
| Interquartile Range (IQR) | 0.45% | 2.5% |
| Standard Deviation (Sample) | 0.55% | 2.5% |
| Standard Deviation (Population) | 0.51% | 2.5% |
Similar Demographics by No Schooling Completed
Demographics Similar to Tsimshian by No Schooling Completed
In terms of no schooling completed, the demographic groups most similar to Tsimshian are American (1.7%, a difference of 0.29%), Slavic (1.7%, a difference of 0.42%), Kiowa (1.6%, a difference of 0.49%), Immigrants from Northern Europe (1.7%, a difference of 0.63%), and Austrian (1.6%, a difference of 0.64%).
| Demographics | Rating | Rank | No Schooling Completed |
| Crow | 99.8 /100 | #54 | Exceptional 1.6% |
| Greeks | 99.8 /100 | #55 | Exceptional 1.6% |
| Immigrants | North America | 99.8 /100 | #56 | Exceptional 1.6% |
| Austrians | 99.8 /100 | #57 | Exceptional 1.6% |
| Kiowa | 99.8 /100 | #58 | Exceptional 1.6% |
| Slavs | 99.8 /100 | #59 | Exceptional 1.7% |
| Americans | 99.8 /100 | #60 | Exceptional 1.7% |
| Tsimshian | 99.8 /100 | #61 | Exceptional 1.7% |
| Immigrants | Northern Europe | 99.8 /100 | #62 | Exceptional 1.7% |
| Russians | 99.8 /100 | #63 | Exceptional 1.7% |
| New Zealanders | 99.7 /100 | #64 | Exceptional 1.7% |
| Serbians | 99.7 /100 | #65 | Exceptional 1.7% |
| Canadians | 99.7 /100 | #66 | Exceptional 1.7% |
| Immigrants | Austria | 99.7 /100 | #67 | Exceptional 1.7% |
| Immigrants | Lithuania | 99.7 /100 | #68 | Exceptional 1.7% |
Demographics Similar to Indians (Asian) by No Schooling Completed
In terms of no schooling completed, the demographic groups most similar to Indians (Asian) are Immigrants from Liberia (2.5%, a difference of 0.13%), West Indian (2.5%, a difference of 0.18%), Fijian (2.5%, a difference of 0.26%), Immigrants from Sierra Leone (2.5%, a difference of 0.30%), and Yuman (2.5%, a difference of 0.43%).
| Demographics | Rating | Rank | No Schooling Completed |
| Immigrants | South America | 0.6 /100 | #257 | Tragic 2.5% |
| Assyrians/Chaldeans/Syriacs | 0.6 /100 | #258 | Tragic 2.5% |
| Immigrants | Jamaica | 0.6 /100 | #259 | Tragic 2.5% |
| Immigrants | Ethiopia | 0.6 /100 | #260 | Tragic 2.5% |
| Armenians | 0.5 /100 | #261 | Tragic 2.5% |
| Immigrants | Sierra Leone | 0.5 /100 | #262 | Tragic 2.5% |
| Immigrants | Liberia | 0.4 /100 | #263 | Tragic 2.5% |
| Indians (Asian) | 0.4 /100 | #264 | Tragic 2.5% |
| West Indians | 0.4 /100 | #265 | Tragic 2.5% |
| Fijians | 0.4 /100 | #266 | Tragic 2.5% |
| Yuman | 0.4 /100 | #267 | Tragic 2.5% |
| Taiwanese | 0.3 /100 | #268 | Tragic 2.5% |
| Immigrants | Nigeria | 0.2 /100 | #269 | Tragic 2.5% |
| Immigrants | Peru | 0.2 /100 | #270 | Tragic 2.5% |
| Cubans | 0.2 /100 | #271 | Tragic 2.5% |