Tsimshian vs Spanish American No Schooling Completed
COMPARE
Tsimshian
Spanish American
No Schooling Completed
No Schooling Completed Comparison
Tsimshian
Spanish Americans
1.7%
NO SCHOOLING COMPLETED
99.8/ 100
METRIC RATING
61st/ 347
METRIC RANK
2.1%
NO SCHOOLING COMPLETED
32.6/ 100
METRIC RATING
190th/ 347
METRIC RANK
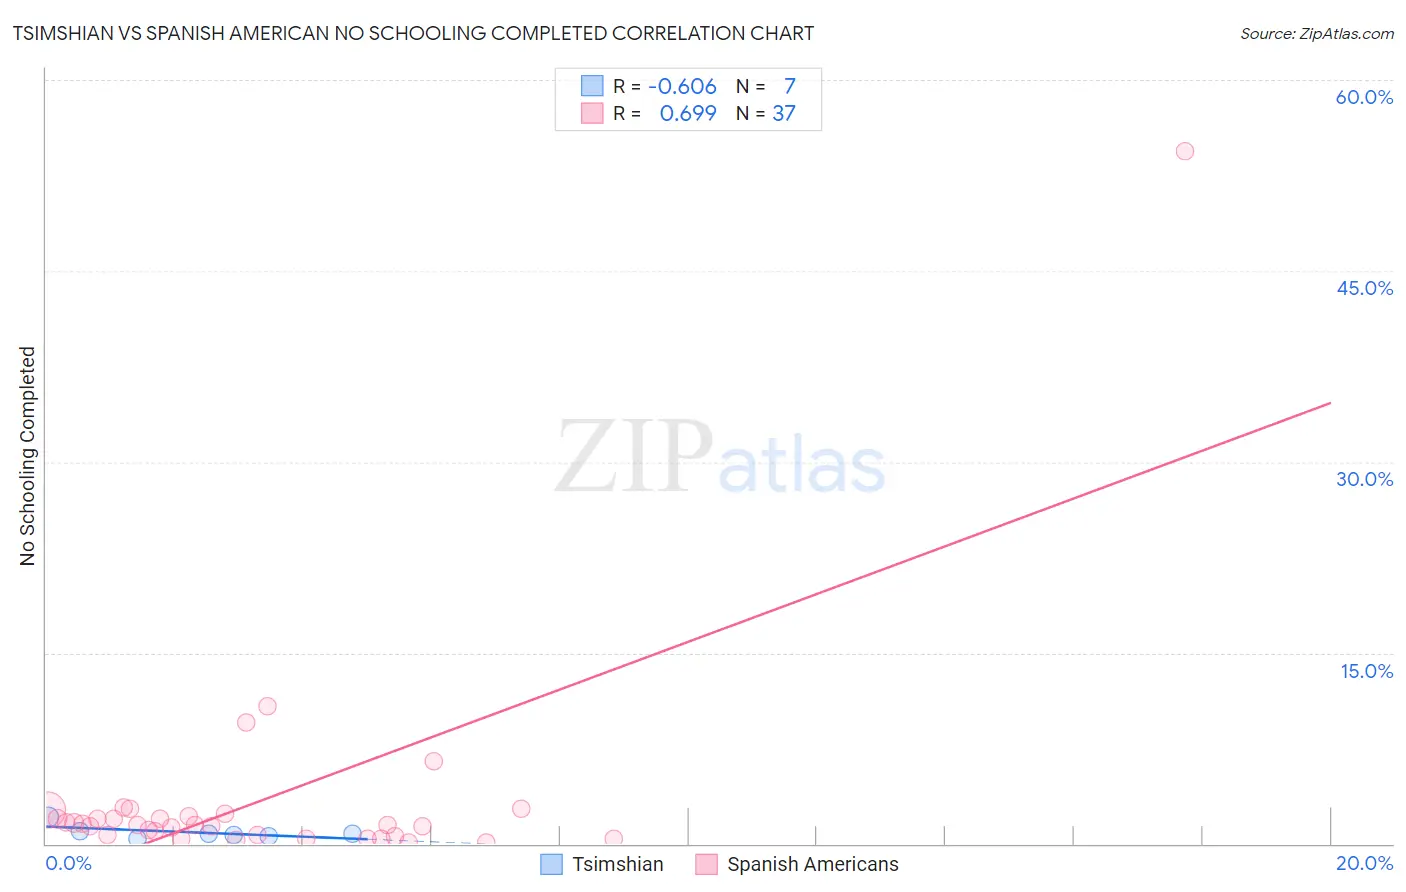
Tsimshian vs Spanish American No Schooling Completed Correlation Chart
The statistical analysis conducted on geographies consisting of 15,573,780 people shows a significant negative correlation between the proportion of Tsimshian and percentage of population with no schooling in the United States with a correlation coefficient (R) of -0.606 and weighted average of 1.7%. Similarly, the statistical analysis conducted on geographies consisting of 102,938,552 people shows a significant positive correlation between the proportion of Spanish Americans and percentage of population with no schooling in the United States with a correlation coefficient (R) of 0.699 and weighted average of 2.1%, a difference of 29.3%.
No Schooling Completed Correlation Summary
| Measurement | Tsimshian | Spanish American |
| Minimum | 0.44% | 0.079% |
| Maximum | 2.1% | 54.4% |
| Range | 1.6% | 54.4% |
| Mean | 0.90% | 3.4% |
| Median | 0.76% | 1.5% |
| Interquartile 25% (IQ1) | 0.55% | 0.64% |
| Interquartile 75% (IQ3) | 1.00% | 2.3% |
| Interquartile Range (IQR) | 0.45% | 1.6% |
| Standard Deviation (Sample) | 0.55% | 8.9% |
| Standard Deviation (Population) | 0.51% | 8.8% |
Similar Demographics by No Schooling Completed
Demographics Similar to Tsimshian by No Schooling Completed
In terms of no schooling completed, the demographic groups most similar to Tsimshian are American (1.7%, a difference of 0.29%), Slavic (1.7%, a difference of 0.42%), Kiowa (1.6%, a difference of 0.49%), Immigrants from Northern Europe (1.7%, a difference of 0.63%), and Austrian (1.6%, a difference of 0.64%).
| Demographics | Rating | Rank | No Schooling Completed |
| Crow | 99.8 /100 | #54 | Exceptional 1.6% |
| Greeks | 99.8 /100 | #55 | Exceptional 1.6% |
| Immigrants | North America | 99.8 /100 | #56 | Exceptional 1.6% |
| Austrians | 99.8 /100 | #57 | Exceptional 1.6% |
| Kiowa | 99.8 /100 | #58 | Exceptional 1.6% |
| Slavs | 99.8 /100 | #59 | Exceptional 1.7% |
| Americans | 99.8 /100 | #60 | Exceptional 1.7% |
| Tsimshian | 99.8 /100 | #61 | Exceptional 1.7% |
| Immigrants | Northern Europe | 99.8 /100 | #62 | Exceptional 1.7% |
| Russians | 99.8 /100 | #63 | Exceptional 1.7% |
| New Zealanders | 99.7 /100 | #64 | Exceptional 1.7% |
| Serbians | 99.7 /100 | #65 | Exceptional 1.7% |
| Canadians | 99.7 /100 | #66 | Exceptional 1.7% |
| Immigrants | Austria | 99.7 /100 | #67 | Exceptional 1.7% |
| Immigrants | Lithuania | 99.7 /100 | #68 | Exceptional 1.7% |
Demographics Similar to Spanish Americans by No Schooling Completed
In terms of no schooling completed, the demographic groups most similar to Spanish Americans are Bermudan (2.1%, a difference of 0.29%), Guamanian/Chamorro (2.2%, a difference of 0.43%), Immigrants from Egypt (2.1%, a difference of 0.51%), Paraguayan (2.2%, a difference of 0.51%), and Immigrants from Kenya (2.1%, a difference of 0.52%).
| Demographics | Rating | Rank | No Schooling Completed |
| Blacks/African Americans | 41.4 /100 | #183 | Average 2.1% |
| Pima | 41.3 /100 | #184 | Average 2.1% |
| Mongolians | 40.8 /100 | #185 | Average 2.1% |
| Immigrants | Bosnia and Herzegovina | 38.6 /100 | #186 | Fair 2.1% |
| Navajo | 36.5 /100 | #187 | Fair 2.1% |
| Immigrants | Kenya | 36.2 /100 | #188 | Fair 2.1% |
| Immigrants | Egypt | 36.1 /100 | #189 | Fair 2.1% |
| Spanish Americans | 32.6 /100 | #190 | Fair 2.1% |
| Bermudans | 30.7 /100 | #191 | Fair 2.1% |
| Guamanians/Chamorros | 29.8 /100 | #192 | Fair 2.2% |
| Paraguayans | 29.3 /100 | #193 | Fair 2.2% |
| Immigrants | Albania | 28.3 /100 | #194 | Fair 2.2% |
| Hawaiians | 27.0 /100 | #195 | Fair 2.2% |
| Immigrants | Ukraine | 26.1 /100 | #196 | Fair 2.2% |
| Immigrants | Southern Europe | 23.8 /100 | #197 | Fair 2.2% |