Tsimshian vs American No Schooling Completed
COMPARE
Tsimshian
American
No Schooling Completed
No Schooling Completed Comparison
Tsimshian
Americans
1.7%
NO SCHOOLING COMPLETED
99.8/ 100
METRIC RATING
61st/ 347
METRIC RANK
1.7%
NO SCHOOLING COMPLETED
99.8/ 100
METRIC RATING
60th/ 347
METRIC RANK
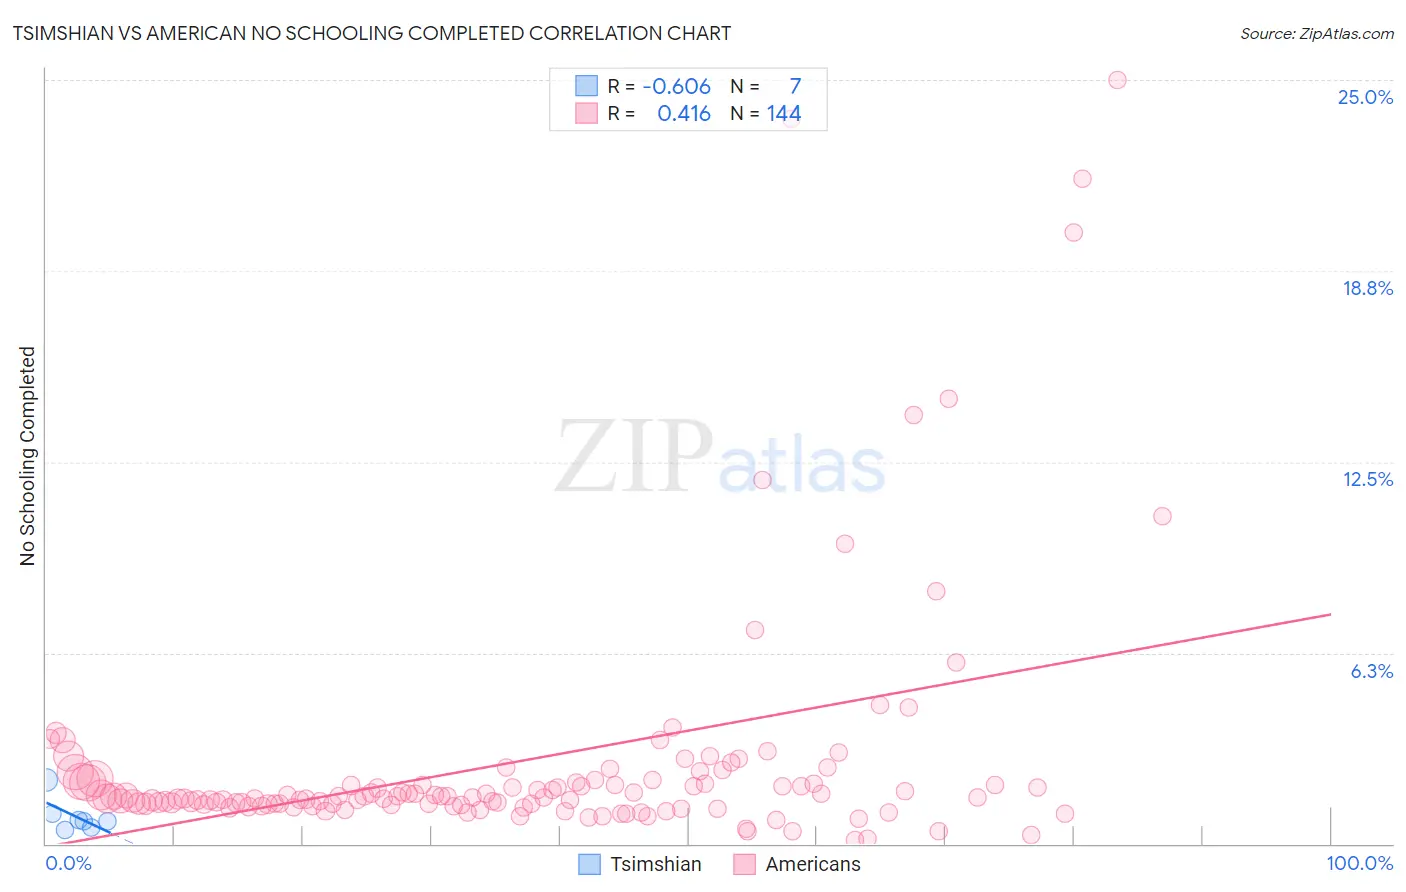
Tsimshian vs American No Schooling Completed Correlation Chart
The statistical analysis conducted on geographies consisting of 15,573,780 people shows a significant negative correlation between the proportion of Tsimshian and percentage of population with no schooling in the United States with a correlation coefficient (R) of -0.606 and weighted average of 1.7%. Similarly, the statistical analysis conducted on geographies consisting of 561,195,336 people shows a moderate positive correlation between the proportion of Americans and percentage of population with no schooling in the United States with a correlation coefficient (R) of 0.416 and weighted average of 1.7%, a difference of 0.29%.
No Schooling Completed Correlation Summary
| Measurement | Tsimshian | American |
| Minimum | 0.44% | 0.13% |
| Maximum | 2.1% | 25.0% |
| Range | 1.6% | 24.9% |
| Mean | 0.90% | 2.7% |
| Median | 0.76% | 1.5% |
| Interquartile 25% (IQ1) | 0.55% | 1.3% |
| Interquartile 75% (IQ3) | 1.00% | 2.0% |
| Interquartile Range (IQR) | 0.45% | 0.72% |
| Standard Deviation (Sample) | 0.55% | 4.1% |
| Standard Deviation (Population) | 0.51% | 4.0% |
Demographics Similar to Tsimshian and Americans by No Schooling Completed
In terms of no schooling completed, the demographic groups most similar to Tsimshian are Slavic (1.7%, a difference of 0.42%), Kiowa (1.6%, a difference of 0.49%), Immigrants from Northern Europe (1.7%, a difference of 0.63%), Austrian (1.6%, a difference of 0.64%), and Russian (1.7%, a difference of 0.67%). Similarly, the demographic groups most similar to Americans are Slavic (1.7%, a difference of 0.12%), Kiowa (1.6%, a difference of 0.19%), Austrian (1.6%, a difference of 0.35%), Greek (1.6%, a difference of 0.66%), and Immigrants from North America (1.6%, a difference of 0.66%).
| Demographics | Rating | Rank | No Schooling Completed |
| Celtics | 99.9 /100 | #50 | Exceptional 1.6% |
| Chippewa | 99.8 /100 | #51 | Exceptional 1.6% |
| Immigrants | Canada | 99.8 /100 | #52 | Exceptional 1.6% |
| Creek | 99.8 /100 | #53 | Exceptional 1.6% |
| Crow | 99.8 /100 | #54 | Exceptional 1.6% |
| Greeks | 99.8 /100 | #55 | Exceptional 1.6% |
| Immigrants | North America | 99.8 /100 | #56 | Exceptional 1.6% |
| Austrians | 99.8 /100 | #57 | Exceptional 1.6% |
| Kiowa | 99.8 /100 | #58 | Exceptional 1.6% |
| Slavs | 99.8 /100 | #59 | Exceptional 1.7% |
| Americans | 99.8 /100 | #60 | Exceptional 1.7% |
| Tsimshian | 99.8 /100 | #61 | Exceptional 1.7% |
| Immigrants | Northern Europe | 99.8 /100 | #62 | Exceptional 1.7% |
| Russians | 99.8 /100 | #63 | Exceptional 1.7% |
| New Zealanders | 99.7 /100 | #64 | Exceptional 1.7% |
| Serbians | 99.7 /100 | #65 | Exceptional 1.7% |
| Canadians | 99.7 /100 | #66 | Exceptional 1.7% |
| Immigrants | Austria | 99.7 /100 | #67 | Exceptional 1.7% |
| Immigrants | Lithuania | 99.7 /100 | #68 | Exceptional 1.7% |
| Chickasaw | 99.6 /100 | #69 | Exceptional 1.7% |
| Immigrants | Netherlands | 99.6 /100 | #70 | Exceptional 1.7% |