Tsimshian vs Subsaharan African Doctorate Degree
COMPARE
Tsimshian
Subsaharan African
Doctorate Degree
Doctorate Degree Comparison
Tsimshian
Sub-Saharan Africans
1.4%
DOCTORATE DEGREE
0.2/ 100
METRIC RATING
297th/ 347
METRIC RANK
1.8%
DOCTORATE DEGREE
25.1/ 100
METRIC RATING
196th/ 347
METRIC RANK
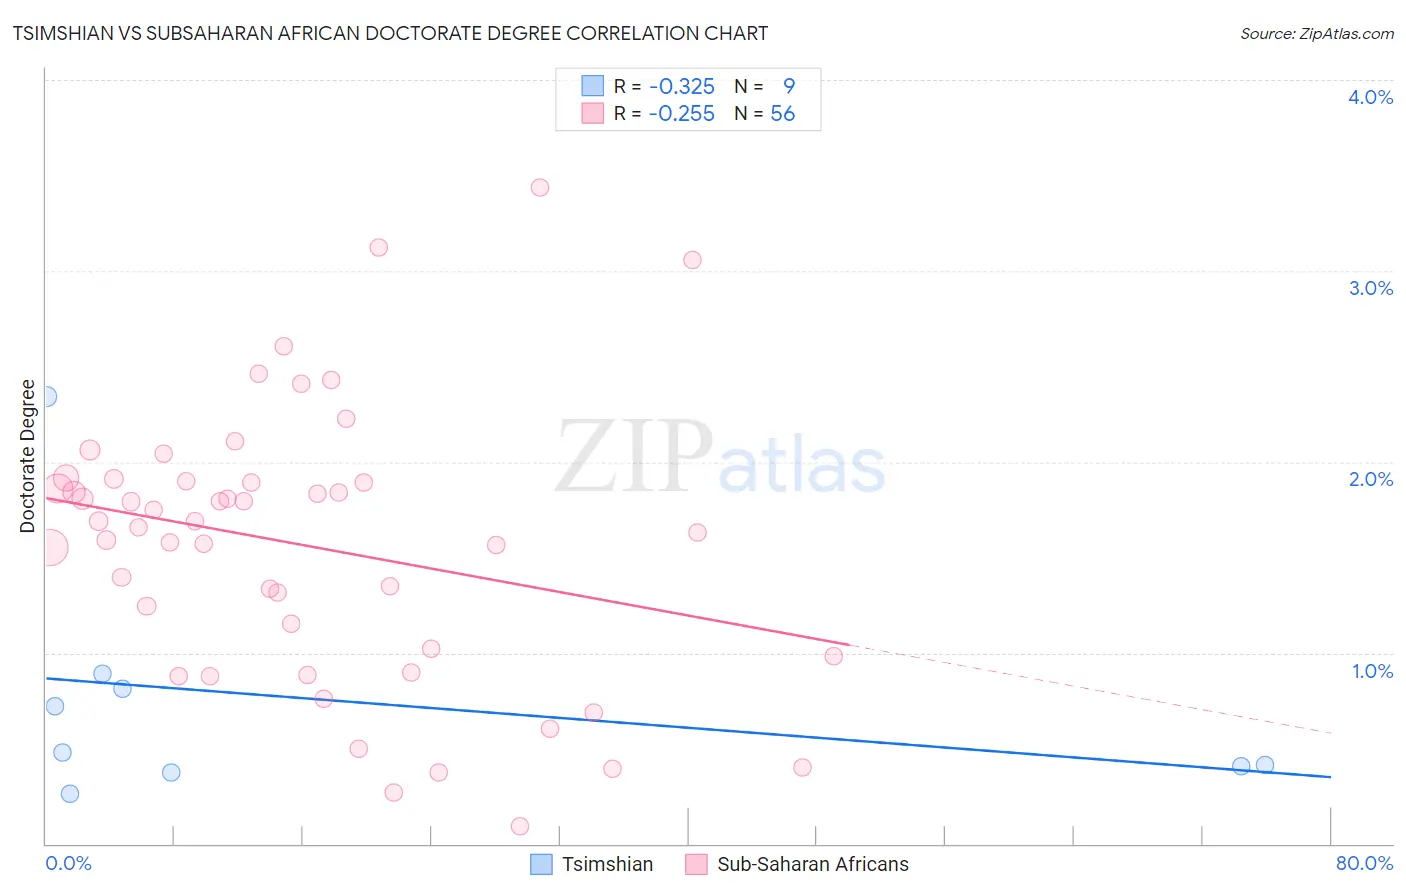
Tsimshian vs Subsaharan African Doctorate Degree Correlation Chart
The statistical analysis conducted on geographies consisting of 15,584,822 people shows a mild negative correlation between the proportion of Tsimshian and percentage of population with at least doctorate degree education in the United States with a correlation coefficient (R) of -0.325 and weighted average of 1.4%. Similarly, the statistical analysis conducted on geographies consisting of 497,272,855 people shows a weak negative correlation between the proportion of Sub-Saharan Africans and percentage of population with at least doctorate degree education in the United States with a correlation coefficient (R) of -0.255 and weighted average of 1.8%, a difference of 25.6%.
Doctorate Degree Correlation Summary
| Measurement | Tsimshian | Subsaharan African |
| Minimum | 0.26% | 0.094% |
| Maximum | 2.3% | 3.4% |
| Range | 2.1% | 3.3% |
| Mean | 0.74% | 1.6% |
| Median | 0.48% | 1.7% |
| Interquartile 25% (IQ1) | 0.39% | 1.0% |
| Interquartile 75% (IQ3) | 0.85% | 1.9% |
| Interquartile Range (IQR) | 0.46% | 0.89% |
| Standard Deviation (Sample) | 0.64% | 0.72% |
| Standard Deviation (Population) | 0.60% | 0.71% |
Similar Demographics by Doctorate Degree
Demographics Similar to Tsimshian by Doctorate Degree
In terms of doctorate degree, the demographic groups most similar to Tsimshian are Immigrants from Ecuador (1.4%, a difference of 0.22%), Puerto Rican (1.4%, a difference of 0.41%), Guatemalan (1.4%, a difference of 0.45%), Belizean (1.4%, a difference of 0.85%), and Samoan (1.4%, a difference of 1.1%).
| Demographics | Rating | Rank | Doctorate Degree |
| Choctaw | 0.3 /100 | #290 | Tragic 1.4% |
| Blacks/African Americans | 0.3 /100 | #291 | Tragic 1.4% |
| Alaska Natives | 0.3 /100 | #292 | Tragic 1.4% |
| Immigrants | Yemen | 0.2 /100 | #293 | Tragic 1.4% |
| Samoans | 0.2 /100 | #294 | Tragic 1.4% |
| Guatemalans | 0.2 /100 | #295 | Tragic 1.4% |
| Immigrants | Ecuador | 0.2 /100 | #296 | Tragic 1.4% |
| Tsimshian | 0.2 /100 | #297 | Tragic 1.4% |
| Puerto Ricans | 0.1 /100 | #298 | Tragic 1.4% |
| Belizeans | 0.1 /100 | #299 | Tragic 1.4% |
| Immigrants | Guatemala | 0.1 /100 | #300 | Tragic 1.4% |
| Hondurans | 0.1 /100 | #301 | Tragic 1.4% |
| Shoshone | 0.1 /100 | #302 | Tragic 1.4% |
| Immigrants | Dominica | 0.1 /100 | #303 | Tragic 1.4% |
| Mexican American Indians | 0.1 /100 | #304 | Tragic 1.4% |
Demographics Similar to Sub-Saharan Africans by Doctorate Degree
In terms of doctorate degree, the demographic groups most similar to Sub-Saharan Africans are Chinese (1.8%, a difference of 0.0%), Immigrants from Somalia (1.8%, a difference of 0.070%), Immigrants from Ghana (1.8%, a difference of 0.090%), Uruguayan (1.8%, a difference of 0.22%), and Immigrants from South America (1.8%, a difference of 0.38%).
| Demographics | Rating | Rank | Doctorate Degree |
| French Canadians | 30.2 /100 | #189 | Fair 1.8% |
| Immigrants | Costa Rica | 30.2 /100 | #190 | Fair 1.8% |
| South Americans | 29.5 /100 | #191 | Fair 1.8% |
| Dutch | 27.4 /100 | #192 | Fair 1.8% |
| German Russians | 27.1 /100 | #193 | Fair 1.8% |
| Uruguayans | 26.2 /100 | #194 | Fair 1.8% |
| Immigrants | Somalia | 25.4 /100 | #195 | Fair 1.8% |
| Sub-Saharan Africans | 25.1 /100 | #196 | Fair 1.8% |
| Chinese | 25.1 /100 | #197 | Fair 1.8% |
| Immigrants | Ghana | 24.6 /100 | #198 | Fair 1.8% |
| Immigrants | South America | 23.3 /100 | #199 | Fair 1.8% |
| Whites/Caucasians | 22.8 /100 | #200 | Fair 1.8% |
| Immigrants | Nigeria | 22.4 /100 | #201 | Fair 1.8% |
| Portuguese | 21.4 /100 | #202 | Fair 1.8% |
| Immigrants | Vietnam | 21.4 /100 | #203 | Fair 1.8% |