Tsimshian vs Korean Doctorate Degree
COMPARE
Tsimshian
Korean
Doctorate Degree
Doctorate Degree Comparison
Tsimshian
Koreans
1.4%
DOCTORATE DEGREE
0.2/ 100
METRIC RATING
297th/ 347
METRIC RANK
1.7%
DOCTORATE DEGREE
14.2/ 100
METRIC RATING
213th/ 347
METRIC RANK
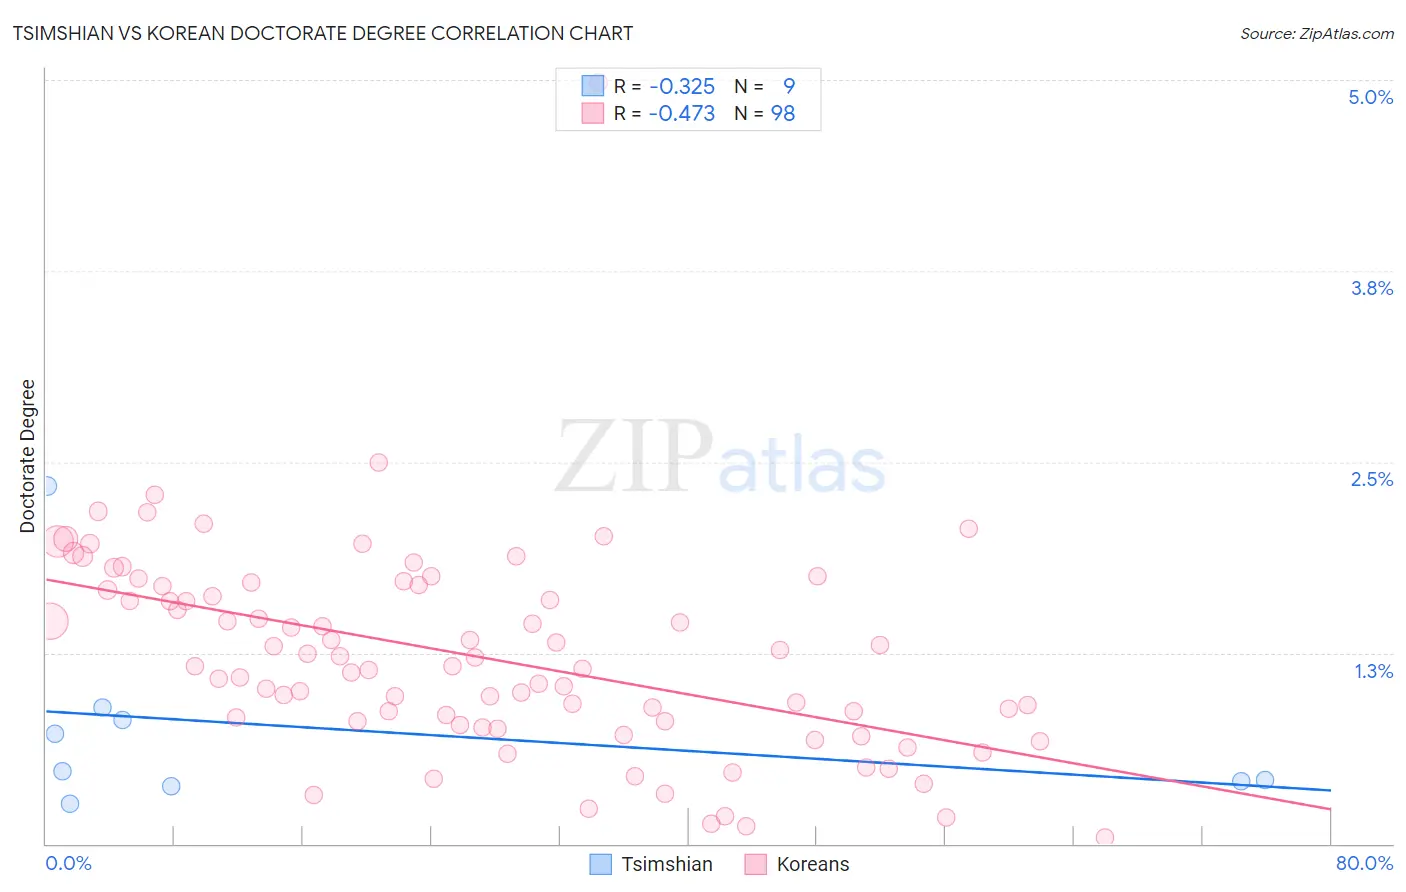
Tsimshian vs Korean Doctorate Degree Correlation Chart
The statistical analysis conducted on geographies consisting of 15,584,822 people shows a mild negative correlation between the proportion of Tsimshian and percentage of population with at least doctorate degree education in the United States with a correlation coefficient (R) of -0.325 and weighted average of 1.4%. Similarly, the statistical analysis conducted on geographies consisting of 500,370,759 people shows a moderate negative correlation between the proportion of Koreans and percentage of population with at least doctorate degree education in the United States with a correlation coefficient (R) of -0.473 and weighted average of 1.7%, a difference of 22.2%.
Doctorate Degree Correlation Summary
| Measurement | Tsimshian | Korean |
| Minimum | 0.26% | 0.043% |
| Maximum | 2.3% | 5.0% |
| Range | 2.1% | 4.9% |
| Mean | 0.74% | 1.2% |
| Median | 0.48% | 1.2% |
| Interquartile 25% (IQ1) | 0.39% | 0.80% |
| Interquartile 75% (IQ3) | 0.85% | 1.7% |
| Interquartile Range (IQR) | 0.46% | 0.88% |
| Standard Deviation (Sample) | 0.64% | 0.69% |
| Standard Deviation (Population) | 0.60% | 0.68% |
Similar Demographics by Doctorate Degree
Demographics Similar to Tsimshian by Doctorate Degree
In terms of doctorate degree, the demographic groups most similar to Tsimshian are Immigrants from Ecuador (1.4%, a difference of 0.22%), Puerto Rican (1.4%, a difference of 0.41%), Guatemalan (1.4%, a difference of 0.45%), Belizean (1.4%, a difference of 0.85%), and Samoan (1.4%, a difference of 1.1%).
| Demographics | Rating | Rank | Doctorate Degree |
| Choctaw | 0.3 /100 | #290 | Tragic 1.4% |
| Blacks/African Americans | 0.3 /100 | #291 | Tragic 1.4% |
| Alaska Natives | 0.3 /100 | #292 | Tragic 1.4% |
| Immigrants | Yemen | 0.2 /100 | #293 | Tragic 1.4% |
| Samoans | 0.2 /100 | #294 | Tragic 1.4% |
| Guatemalans | 0.2 /100 | #295 | Tragic 1.4% |
| Immigrants | Ecuador | 0.2 /100 | #296 | Tragic 1.4% |
| Tsimshian | 0.2 /100 | #297 | Tragic 1.4% |
| Puerto Ricans | 0.1 /100 | #298 | Tragic 1.4% |
| Belizeans | 0.1 /100 | #299 | Tragic 1.4% |
| Immigrants | Guatemala | 0.1 /100 | #300 | Tragic 1.4% |
| Hondurans | 0.1 /100 | #301 | Tragic 1.4% |
| Shoshone | 0.1 /100 | #302 | Tragic 1.4% |
| Immigrants | Dominica | 0.1 /100 | #303 | Tragic 1.4% |
| Mexican American Indians | 0.1 /100 | #304 | Tragic 1.4% |
Demographics Similar to Koreans by Doctorate Degree
In terms of doctorate degree, the demographic groups most similar to Koreans are Pueblo (1.7%, a difference of 0.010%), Immigrants from South Eastern Asia (1.7%, a difference of 0.15%), Alaskan Athabascan (1.7%, a difference of 0.15%), Immigrants from Burma/Myanmar (1.7%, a difference of 0.25%), and Immigrants from Armenia (1.7%, a difference of 0.27%).
| Demographics | Rating | Rank | Doctorate Degree |
| Immigrants | Peru | 17.6 /100 | #206 | Poor 1.7% |
| Yugoslavians | 17.1 /100 | #207 | Poor 1.7% |
| Colombians | 16.1 /100 | #208 | Poor 1.7% |
| Immigrants | Western Africa | 15.4 /100 | #209 | Poor 1.7% |
| Tongans | 15.1 /100 | #210 | Poor 1.7% |
| Immigrants | Armenia | 15.1 /100 | #211 | Poor 1.7% |
| Immigrants | South Eastern Asia | 14.7 /100 | #212 | Poor 1.7% |
| Koreans | 14.2 /100 | #213 | Poor 1.7% |
| Pueblo | 14.2 /100 | #214 | Poor 1.7% |
| Alaskan Athabascans | 13.8 /100 | #215 | Poor 1.7% |
| Immigrants | Burma/Myanmar | 13.5 /100 | #216 | Poor 1.7% |
| Spanish Americans | 12.9 /100 | #217 | Poor 1.7% |
| Tlingit-Haida | 11.9 /100 | #218 | Poor 1.7% |
| Immigrants | Iraq | 10.7 /100 | #219 | Poor 1.7% |
| Immigrants | Uruguay | 9.2 /100 | #220 | Tragic 1.7% |