Tsimshian vs Ecuadorian Doctorate Degree
COMPARE
Tsimshian
Ecuadorian
Doctorate Degree
Doctorate Degree Comparison
Tsimshian
Ecuadorians
1.4%
DOCTORATE DEGREE
0.2/ 100
METRIC RATING
297th/ 347
METRIC RANK
1.5%
DOCTORATE DEGREE
0.4/ 100
METRIC RATING
280th/ 347
METRIC RANK
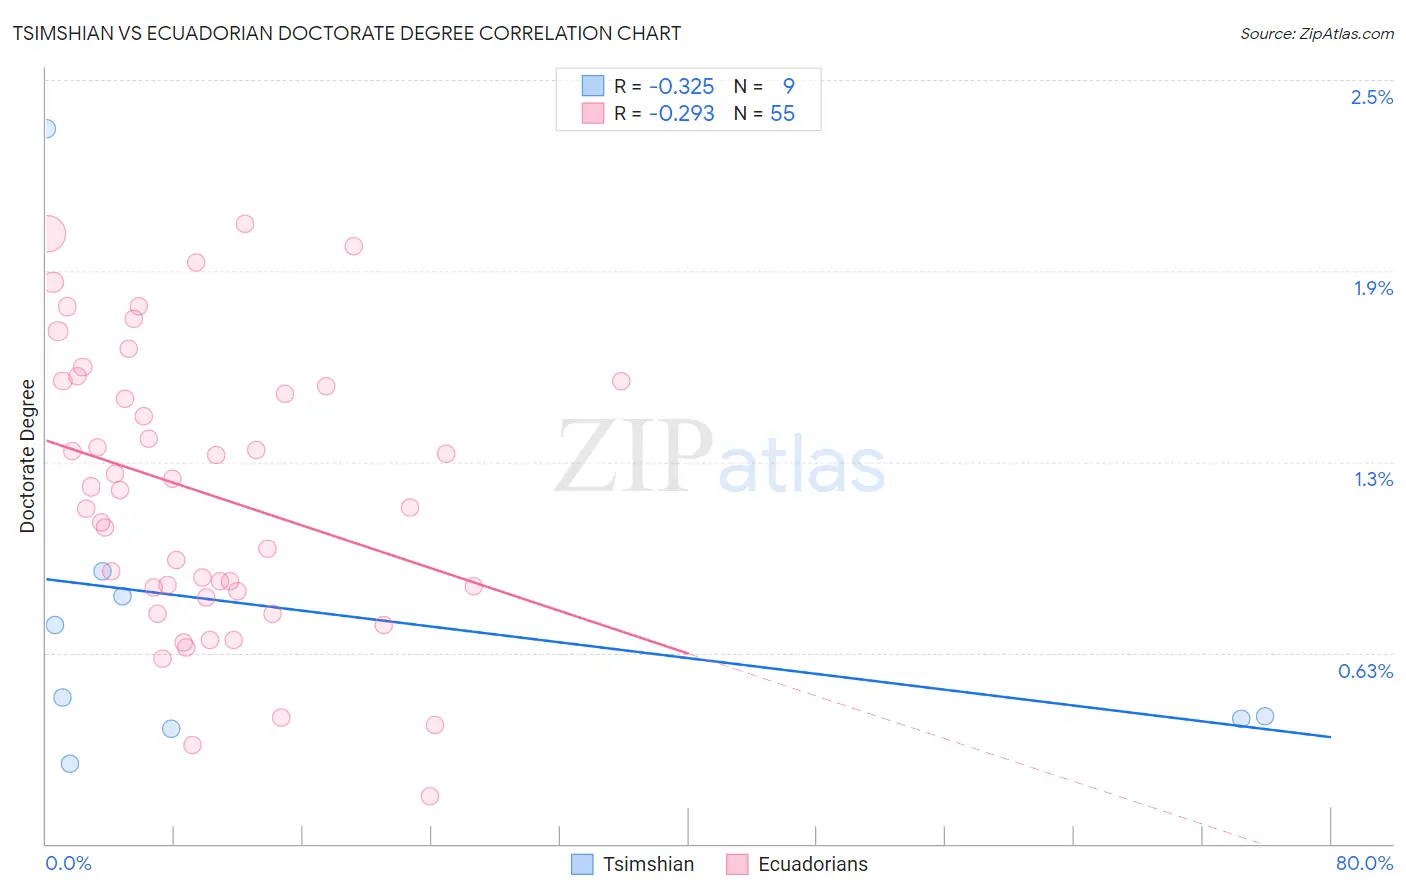
Tsimshian vs Ecuadorian Doctorate Degree Correlation Chart
The statistical analysis conducted on geographies consisting of 15,584,822 people shows a mild negative correlation between the proportion of Tsimshian and percentage of population with at least doctorate degree education in the United States with a correlation coefficient (R) of -0.325 and weighted average of 1.4%. Similarly, the statistical analysis conducted on geographies consisting of 316,205,329 people shows a weak negative correlation between the proportion of Ecuadorians and percentage of population with at least doctorate degree education in the United States with a correlation coefficient (R) of -0.293 and weighted average of 1.5%, a difference of 3.8%.
Doctorate Degree Correlation Summary
| Measurement | Tsimshian | Ecuadorian |
| Minimum | 0.26% | 0.16% |
| Maximum | 2.3% | 2.0% |
| Range | 2.1% | 1.9% |
| Mean | 0.74% | 1.1% |
| Median | 0.48% | 1.2% |
| Interquartile 25% (IQ1) | 0.39% | 0.83% |
| Interquartile 75% (IQ3) | 0.85% | 1.5% |
| Interquartile Range (IQR) | 0.46% | 0.68% |
| Standard Deviation (Sample) | 0.64% | 0.46% |
| Standard Deviation (Population) | 0.60% | 0.45% |
Demographics Similar to Tsimshian and Ecuadorians by Doctorate Degree
In terms of doctorate degree, the demographic groups most similar to Tsimshian are Immigrants from Ecuador (1.4%, a difference of 0.22%), Puerto Rican (1.4%, a difference of 0.41%), Guatemalan (1.4%, a difference of 0.45%), Samoan (1.4%, a difference of 1.1%), and Immigrants from Yemen (1.4%, a difference of 1.9%). Similarly, the demographic groups most similar to Ecuadorians are Marshallese (1.5%, a difference of 0.010%), Tohono O'odham (1.5%, a difference of 0.060%), British West Indian (1.5%, a difference of 0.12%), Central American (1.5%, a difference of 0.16%), and Jamaican (1.5%, a difference of 0.20%).
| Demographics | Rating | Rank | Doctorate Degree |
| Hawaiians | 0.4 /100 | #278 | Tragic 1.5% |
| Marshallese | 0.4 /100 | #279 | Tragic 1.5% |
| Ecuadorians | 0.4 /100 | #280 | Tragic 1.5% |
| Tohono O'odham | 0.4 /100 | #281 | Tragic 1.5% |
| British West Indians | 0.3 /100 | #282 | Tragic 1.5% |
| Central Americans | 0.3 /100 | #283 | Tragic 1.5% |
| Jamaicans | 0.3 /100 | #284 | Tragic 1.5% |
| Malaysians | 0.3 /100 | #285 | Tragic 1.5% |
| Cherokee | 0.3 /100 | #286 | Tragic 1.5% |
| Cajuns | 0.3 /100 | #287 | Tragic 1.5% |
| Immigrants | El Salvador | 0.3 /100 | #288 | Tragic 1.4% |
| Cape Verdeans | 0.3 /100 | #289 | Tragic 1.4% |
| Choctaw | 0.3 /100 | #290 | Tragic 1.4% |
| Blacks/African Americans | 0.3 /100 | #291 | Tragic 1.4% |
| Alaska Natives | 0.3 /100 | #292 | Tragic 1.4% |
| Immigrants | Yemen | 0.2 /100 | #293 | Tragic 1.4% |
| Samoans | 0.2 /100 | #294 | Tragic 1.4% |
| Guatemalans | 0.2 /100 | #295 | Tragic 1.4% |
| Immigrants | Ecuador | 0.2 /100 | #296 | Tragic 1.4% |
| Tsimshian | 0.2 /100 | #297 | Tragic 1.4% |
| Puerto Ricans | 0.1 /100 | #298 | Tragic 1.4% |