Cajun vs Hispanic or Latino Doctorate Degree
COMPARE
Cajun
Hispanic or Latino
Doctorate Degree
Doctorate Degree Comparison
Cajuns
Hispanics or Latinos
1.5%
DOCTORATE DEGREE
0.3/ 100
METRIC RATING
287th/ 347
METRIC RANK
1.3%
DOCTORATE DEGREE
0.0/ 100
METRIC RATING
327th/ 347
METRIC RANK
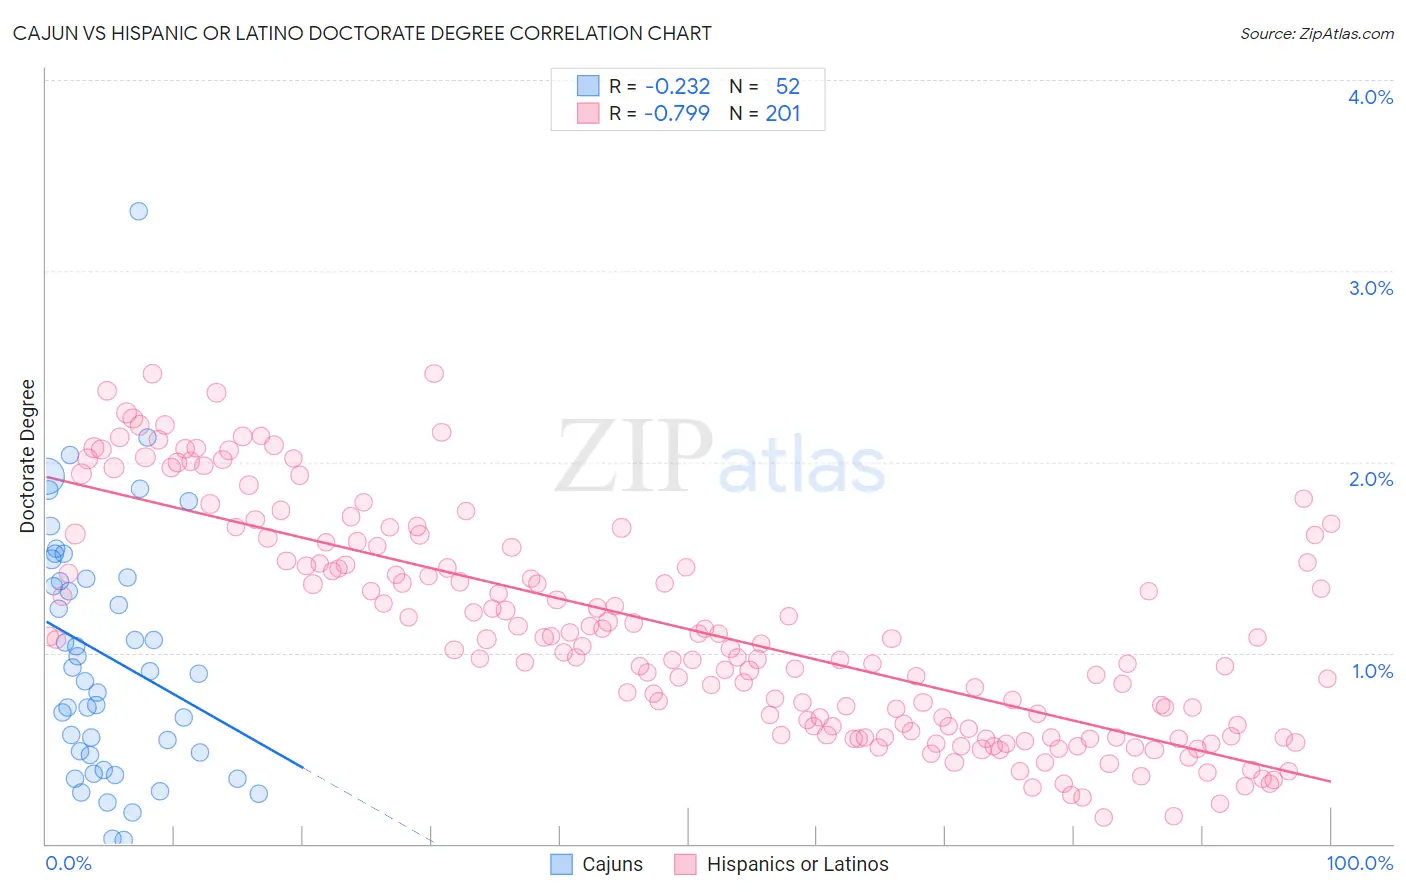
Cajun vs Hispanic or Latino Doctorate Degree Correlation Chart
The statistical analysis conducted on geographies consisting of 148,318,310 people shows a weak negative correlation between the proportion of Cajuns and percentage of population with at least doctorate degree education in the United States with a correlation coefficient (R) of -0.232 and weighted average of 1.5%. Similarly, the statistical analysis conducted on geographies consisting of 551,277,814 people shows a strong negative correlation between the proportion of Hispanics or Latinos and percentage of population with at least doctorate degree education in the United States with a correlation coefficient (R) of -0.799 and weighted average of 1.3%, a difference of 10.3%.
Doctorate Degree Correlation Summary
| Measurement | Cajun | Hispanic or Latino |
| Minimum | 0.021% | 0.14% |
| Maximum | 3.3% | 2.5% |
| Range | 3.3% | 2.3% |
| Mean | 0.98% | 1.1% |
| Median | 0.90% | 1.0% |
| Interquartile 25% (IQ1) | 0.47% | 0.60% |
| Interquartile 75% (IQ3) | 1.4% | 1.6% |
| Interquartile Range (IQR) | 0.92% | 0.96% |
| Standard Deviation (Sample) | 0.65% | 0.58% |
| Standard Deviation (Population) | 0.65% | 0.58% |
Similar Demographics by Doctorate Degree
Demographics Similar to Cajuns by Doctorate Degree
In terms of doctorate degree, the demographic groups most similar to Cajuns are Cherokee (1.5%, a difference of 0.17%), Immigrants from El Salvador (1.4%, a difference of 0.18%), Cape Verdean (1.4%, a difference of 0.31%), Choctaw (1.4%, a difference of 0.33%), and Malaysian (1.5%, a difference of 0.34%).
| Demographics | Rating | Rank | Doctorate Degree |
| Ecuadorians | 0.4 /100 | #280 | Tragic 1.5% |
| Tohono O'odham | 0.4 /100 | #281 | Tragic 1.5% |
| British West Indians | 0.3 /100 | #282 | Tragic 1.5% |
| Central Americans | 0.3 /100 | #283 | Tragic 1.5% |
| Jamaicans | 0.3 /100 | #284 | Tragic 1.5% |
| Malaysians | 0.3 /100 | #285 | Tragic 1.5% |
| Cherokee | 0.3 /100 | #286 | Tragic 1.5% |
| Cajuns | 0.3 /100 | #287 | Tragic 1.5% |
| Immigrants | El Salvador | 0.3 /100 | #288 | Tragic 1.4% |
| Cape Verdeans | 0.3 /100 | #289 | Tragic 1.4% |
| Choctaw | 0.3 /100 | #290 | Tragic 1.4% |
| Blacks/African Americans | 0.3 /100 | #291 | Tragic 1.4% |
| Alaska Natives | 0.3 /100 | #292 | Tragic 1.4% |
| Immigrants | Yemen | 0.2 /100 | #293 | Tragic 1.4% |
| Samoans | 0.2 /100 | #294 | Tragic 1.4% |
Demographics Similar to Hispanics or Latinos by Doctorate Degree
In terms of doctorate degree, the demographic groups most similar to Hispanics or Latinos are Immigrants from Cabo Verde (1.3%, a difference of 0.29%), Pima (1.3%, a difference of 0.31%), Inupiat (1.3%, a difference of 0.58%), Haitian (1.3%, a difference of 0.63%), and Native/Alaskan (1.3%, a difference of 0.70%).
| Demographics | Rating | Rank | Doctorate Degree |
| Immigrants | St. Vincent and the Grenadines | 0.1 /100 | #320 | Tragic 1.3% |
| Dutch West Indians | 0.1 /100 | #321 | Tragic 1.3% |
| Seminole | 0.1 /100 | #322 | Tragic 1.3% |
| Immigrants | Belize | 0.1 /100 | #323 | Tragic 1.3% |
| Natives/Alaskans | 0.0 /100 | #324 | Tragic 1.3% |
| Pima | 0.0 /100 | #325 | Tragic 1.3% |
| Immigrants | Cabo Verde | 0.0 /100 | #326 | Tragic 1.3% |
| Hispanics or Latinos | 0.0 /100 | #327 | Tragic 1.3% |
| Inupiat | 0.0 /100 | #328 | Tragic 1.3% |
| Haitians | 0.0 /100 | #329 | Tragic 1.3% |
| Yup'ik | 0.0 /100 | #330 | Tragic 1.3% |
| Immigrants | Latin America | 0.0 /100 | #331 | Tragic 1.3% |
| Yakama | 0.0 /100 | #332 | Tragic 1.3% |
| Immigrants | Caribbean | 0.0 /100 | #333 | Tragic 1.3% |
| Immigrants | Dominican Republic | 0.0 /100 | #334 | Tragic 1.3% |