Immigrants from Jamaica vs Hispanic or Latino Doctorate Degree
COMPARE
Immigrants from Jamaica
Hispanic or Latino
Doctorate Degree
Doctorate Degree Comparison
Immigrants from Jamaica
Hispanics or Latinos
1.4%
DOCTORATE DEGREE
0.1/ 100
METRIC RATING
310th/ 347
METRIC RANK
1.3%
DOCTORATE DEGREE
0.0/ 100
METRIC RATING
327th/ 347
METRIC RANK
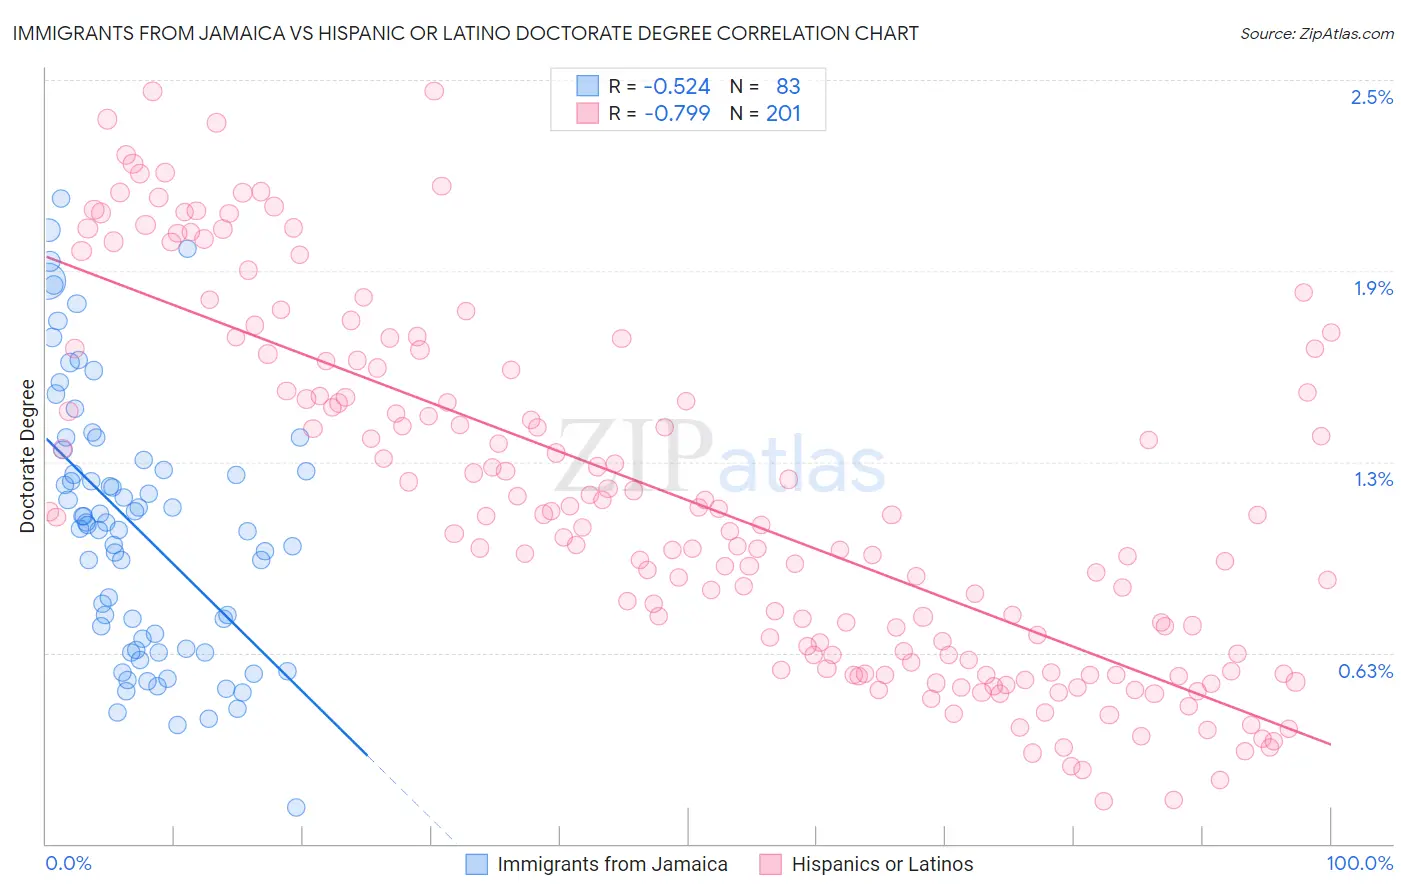
Immigrants from Jamaica vs Hispanic or Latino Doctorate Degree Correlation Chart
The statistical analysis conducted on geographies consisting of 299,587,727 people shows a substantial negative correlation between the proportion of Immigrants from Jamaica and percentage of population with at least doctorate degree education in the United States with a correlation coefficient (R) of -0.524 and weighted average of 1.4%. Similarly, the statistical analysis conducted on geographies consisting of 551,277,814 people shows a strong negative correlation between the proportion of Hispanics or Latinos and percentage of population with at least doctorate degree education in the United States with a correlation coefficient (R) of -0.799 and weighted average of 1.3%, a difference of 3.9%.
Doctorate Degree Correlation Summary
| Measurement | Immigrants from Jamaica | Hispanic or Latino |
| Minimum | 0.12% | 0.14% |
| Maximum | 2.1% | 2.5% |
| Range | 2.0% | 2.3% |
| Mean | 1.0% | 1.1% |
| Median | 1.0% | 1.0% |
| Interquartile 25% (IQ1) | 0.64% | 0.60% |
| Interquartile 75% (IQ3) | 1.3% | 1.6% |
| Interquartile Range (IQR) | 0.62% | 0.96% |
| Standard Deviation (Sample) | 0.43% | 0.58% |
| Standard Deviation (Population) | 0.43% | 0.58% |
Demographics Similar to Immigrants from Jamaica and Hispanics or Latinos by Doctorate Degree
In terms of doctorate degree, the demographic groups most similar to Immigrants from Jamaica are Immigrants from Honduras (1.4%, a difference of 0.18%), Immigrants from Grenada (1.4%, a difference of 0.30%), Immigrants from Nicaragua (1.4%, a difference of 0.55%), Immigrants from Laos (1.4%, a difference of 0.71%), and Menominee (1.4%, a difference of 0.87%). Similarly, the demographic groups most similar to Hispanics or Latinos are Immigrants from Cabo Verde (1.3%, a difference of 0.29%), Pima (1.3%, a difference of 0.31%), Inupiat (1.3%, a difference of 0.58%), Native/Alaskan (1.3%, a difference of 0.70%), and Immigrants from Belize (1.3%, a difference of 1.0%).
| Demographics | Rating | Rank | Doctorate Degree |
| Immigrants | Laos | 0.1 /100 | #308 | Tragic 1.4% |
| Immigrants | Grenada | 0.1 /100 | #309 | Tragic 1.4% |
| Immigrants | Jamaica | 0.1 /100 | #310 | Tragic 1.4% |
| Immigrants | Honduras | 0.1 /100 | #311 | Tragic 1.4% |
| Immigrants | Nicaragua | 0.1 /100 | #312 | Tragic 1.4% |
| Menominee | 0.1 /100 | #313 | Tragic 1.4% |
| Dominicans | 0.1 /100 | #314 | Tragic 1.4% |
| Immigrants | Azores | 0.1 /100 | #315 | Tragic 1.4% |
| Navajo | 0.1 /100 | #316 | Tragic 1.4% |
| Immigrants | Micronesia | 0.1 /100 | #317 | Tragic 1.3% |
| Creek | 0.1 /100 | #318 | Tragic 1.3% |
| Immigrants | Guyana | 0.1 /100 | #319 | Tragic 1.3% |
| Immigrants | St. Vincent and the Grenadines | 0.1 /100 | #320 | Tragic 1.3% |
| Dutch West Indians | 0.1 /100 | #321 | Tragic 1.3% |
| Seminole | 0.1 /100 | #322 | Tragic 1.3% |
| Immigrants | Belize | 0.1 /100 | #323 | Tragic 1.3% |
| Natives/Alaskans | 0.0 /100 | #324 | Tragic 1.3% |
| Pima | 0.0 /100 | #325 | Tragic 1.3% |
| Immigrants | Cabo Verde | 0.0 /100 | #326 | Tragic 1.3% |
| Hispanics or Latinos | 0.0 /100 | #327 | Tragic 1.3% |
| Inupiat | 0.0 /100 | #328 | Tragic 1.3% |