French American Indian vs Hispanic or Latino Doctorate Degree
COMPARE
French American Indian
Hispanic or Latino
Doctorate Degree
Doctorate Degree Comparison
French American Indians
Hispanics or Latinos
1.6%
DOCTORATE DEGREE
2.0/ 100
METRIC RATING
244th/ 347
METRIC RANK
1.3%
DOCTORATE DEGREE
0.0/ 100
METRIC RATING
327th/ 347
METRIC RANK
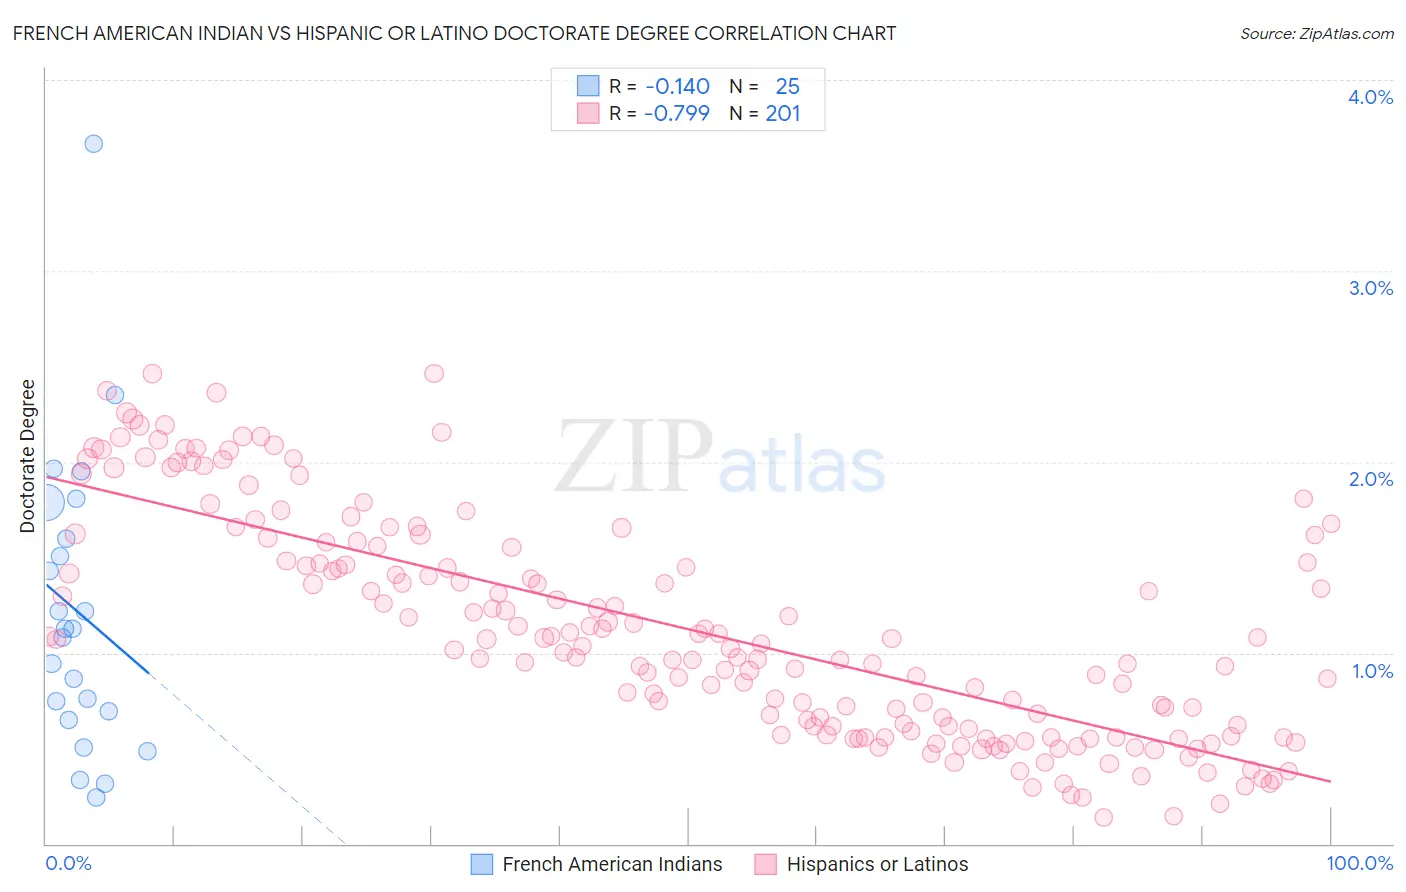
French American Indian vs Hispanic or Latino Doctorate Degree Correlation Chart
The statistical analysis conducted on geographies consisting of 131,174,413 people shows a poor negative correlation between the proportion of French American Indians and percentage of population with at least doctorate degree education in the United States with a correlation coefficient (R) of -0.140 and weighted average of 1.6%. Similarly, the statistical analysis conducted on geographies consisting of 551,277,814 people shows a strong negative correlation between the proportion of Hispanics or Latinos and percentage of population with at least doctorate degree education in the United States with a correlation coefficient (R) of -0.799 and weighted average of 1.3%, a difference of 20.0%.
Doctorate Degree Correlation Summary
| Measurement | French American Indian | Hispanic or Latino |
| Minimum | 0.24% | 0.14% |
| Maximum | 3.7% | 2.5% |
| Range | 3.4% | 2.3% |
| Mean | 1.2% | 1.1% |
| Median | 1.1% | 1.0% |
| Interquartile 25% (IQ1) | 0.67% | 0.60% |
| Interquartile 75% (IQ3) | 1.7% | 1.6% |
| Interquartile Range (IQR) | 1.0% | 0.96% |
| Standard Deviation (Sample) | 0.77% | 0.58% |
| Standard Deviation (Population) | 0.75% | 0.58% |
Similar Demographics by Doctorate Degree
Demographics Similar to French American Indians by Doctorate Degree
In terms of doctorate degree, the demographic groups most similar to French American Indians are Native Hawaiian (1.6%, a difference of 0.19%), Ottawa (1.6%, a difference of 0.32%), Delaware (1.6%, a difference of 0.38%), Hmong (1.6%, a difference of 0.47%), and Comanche (1.6%, a difference of 0.49%).
| Demographics | Rating | Rank | Doctorate Degree |
| Iroquois | 2.7 /100 | #237 | Tragic 1.6% |
| Immigrants | Congo | 2.6 /100 | #238 | Tragic 1.6% |
| West Indians | 2.5 /100 | #239 | Tragic 1.6% |
| Immigrants | Panama | 2.4 /100 | #240 | Tragic 1.6% |
| Cheyenne | 2.3 /100 | #241 | Tragic 1.6% |
| Ottawa | 2.2 /100 | #242 | Tragic 1.6% |
| Native Hawaiians | 2.1 /100 | #243 | Tragic 1.6% |
| French American Indians | 2.0 /100 | #244 | Tragic 1.6% |
| Delaware | 1.9 /100 | #245 | Tragic 1.6% |
| Hmong | 1.8 /100 | #246 | Tragic 1.6% |
| Comanche | 1.8 /100 | #247 | Tragic 1.6% |
| Africans | 1.8 /100 | #248 | Tragic 1.6% |
| Potawatomi | 1.6 /100 | #249 | Tragic 1.6% |
| Immigrants | Fiji | 1.6 /100 | #250 | Tragic 1.6% |
| Apache | 1.3 /100 | #251 | Tragic 1.5% |
Demographics Similar to Hispanics or Latinos by Doctorate Degree
In terms of doctorate degree, the demographic groups most similar to Hispanics or Latinos are Immigrants from Cabo Verde (1.3%, a difference of 0.29%), Pima (1.3%, a difference of 0.31%), Inupiat (1.3%, a difference of 0.58%), Haitian (1.3%, a difference of 0.63%), and Native/Alaskan (1.3%, a difference of 0.70%).
| Demographics | Rating | Rank | Doctorate Degree |
| Immigrants | St. Vincent and the Grenadines | 0.1 /100 | #320 | Tragic 1.3% |
| Dutch West Indians | 0.1 /100 | #321 | Tragic 1.3% |
| Seminole | 0.1 /100 | #322 | Tragic 1.3% |
| Immigrants | Belize | 0.1 /100 | #323 | Tragic 1.3% |
| Natives/Alaskans | 0.0 /100 | #324 | Tragic 1.3% |
| Pima | 0.0 /100 | #325 | Tragic 1.3% |
| Immigrants | Cabo Verde | 0.0 /100 | #326 | Tragic 1.3% |
| Hispanics or Latinos | 0.0 /100 | #327 | Tragic 1.3% |
| Inupiat | 0.0 /100 | #328 | Tragic 1.3% |
| Haitians | 0.0 /100 | #329 | Tragic 1.3% |
| Yup'ik | 0.0 /100 | #330 | Tragic 1.3% |
| Immigrants | Latin America | 0.0 /100 | #331 | Tragic 1.3% |
| Yakama | 0.0 /100 | #332 | Tragic 1.3% |
| Immigrants | Caribbean | 0.0 /100 | #333 | Tragic 1.3% |
| Immigrants | Dominican Republic | 0.0 /100 | #334 | Tragic 1.3% |