Haitian vs Ecuadorian Doctorate Degree
COMPARE
Haitian
Ecuadorian
Doctorate Degree
Doctorate Degree Comparison
Haitians
Ecuadorians
1.3%
DOCTORATE DEGREE
0.0/ 100
METRIC RATING
329th/ 347
METRIC RANK
1.5%
DOCTORATE DEGREE
0.4/ 100
METRIC RATING
280th/ 347
METRIC RANK
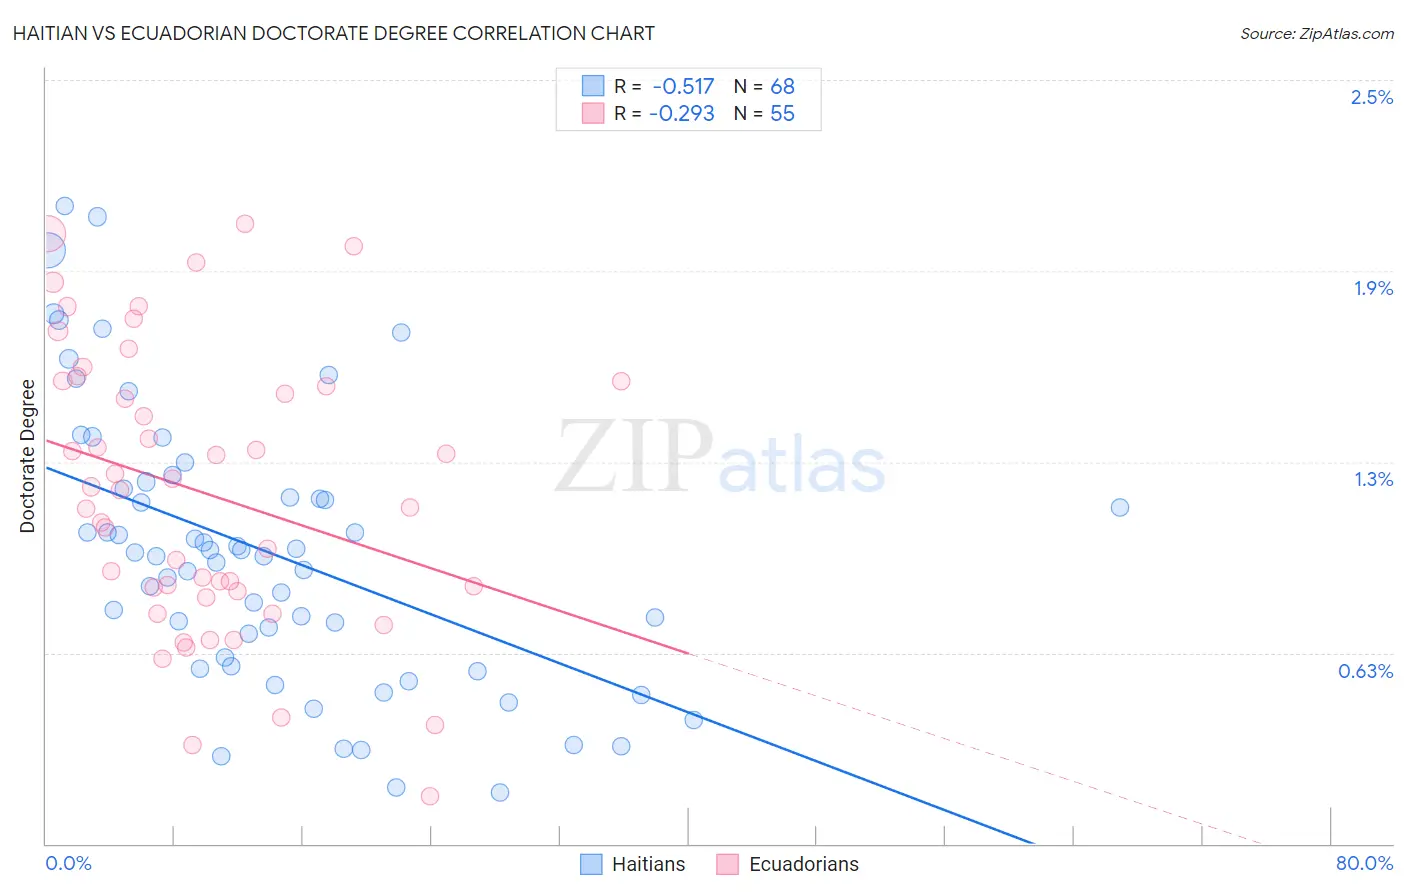
Haitian vs Ecuadorian Doctorate Degree Correlation Chart
The statistical analysis conducted on geographies consisting of 285,866,537 people shows a substantial negative correlation between the proportion of Haitians and percentage of population with at least doctorate degree education in the United States with a correlation coefficient (R) of -0.517 and weighted average of 1.3%. Similarly, the statistical analysis conducted on geographies consisting of 316,205,329 people shows a weak negative correlation between the proportion of Ecuadorians and percentage of population with at least doctorate degree education in the United States with a correlation coefficient (R) of -0.293 and weighted average of 1.5%, a difference of 11.7%.
Doctorate Degree Correlation Summary
| Measurement | Haitian | Ecuadorian |
| Minimum | 0.17% | 0.16% |
| Maximum | 2.1% | 2.0% |
| Range | 1.9% | 1.9% |
| Mean | 0.95% | 1.1% |
| Median | 0.95% | 1.2% |
| Interquartile 25% (IQ1) | 0.60% | 0.83% |
| Interquartile 75% (IQ3) | 1.2% | 1.5% |
| Interquartile Range (IQR) | 0.58% | 0.68% |
| Standard Deviation (Sample) | 0.45% | 0.46% |
| Standard Deviation (Population) | 0.45% | 0.45% |
Similar Demographics by Doctorate Degree
Demographics Similar to Haitians by Doctorate Degree
In terms of doctorate degree, the demographic groups most similar to Haitians are Inupiat (1.3%, a difference of 0.050%), Yup'ik (1.3%, a difference of 0.22%), Immigrants from Latin America (1.3%, a difference of 0.23%), Hispanic or Latino (1.3%, a difference of 0.63%), and Immigrants from Cabo Verde (1.3%, a difference of 0.92%).
| Demographics | Rating | Rank | Doctorate Degree |
| Seminole | 0.1 /100 | #322 | Tragic 1.3% |
| Immigrants | Belize | 0.1 /100 | #323 | Tragic 1.3% |
| Natives/Alaskans | 0.0 /100 | #324 | Tragic 1.3% |
| Pima | 0.0 /100 | #325 | Tragic 1.3% |
| Immigrants | Cabo Verde | 0.0 /100 | #326 | Tragic 1.3% |
| Hispanics or Latinos | 0.0 /100 | #327 | Tragic 1.3% |
| Inupiat | 0.0 /100 | #328 | Tragic 1.3% |
| Haitians | 0.0 /100 | #329 | Tragic 1.3% |
| Yup'ik | 0.0 /100 | #330 | Tragic 1.3% |
| Immigrants | Latin America | 0.0 /100 | #331 | Tragic 1.3% |
| Yakama | 0.0 /100 | #332 | Tragic 1.3% |
| Immigrants | Caribbean | 0.0 /100 | #333 | Tragic 1.3% |
| Immigrants | Dominican Republic | 0.0 /100 | #334 | Tragic 1.3% |
| Immigrants | Haiti | 0.0 /100 | #335 | Tragic 1.3% |
| Nepalese | 0.0 /100 | #336 | Tragic 1.3% |
Demographics Similar to Ecuadorians by Doctorate Degree
In terms of doctorate degree, the demographic groups most similar to Ecuadorians are Marshallese (1.5%, a difference of 0.010%), Tohono O'odham (1.5%, a difference of 0.060%), British West Indian (1.5%, a difference of 0.12%), Central American (1.5%, a difference of 0.16%), and Jamaican (1.5%, a difference of 0.20%).
| Demographics | Rating | Rank | Doctorate Degree |
| Sioux | 0.4 /100 | #273 | Tragic 1.5% |
| Yaqui | 0.4 /100 | #274 | Tragic 1.5% |
| Aleuts | 0.4 /100 | #275 | Tragic 1.5% |
| Paiute | 0.4 /100 | #276 | Tragic 1.5% |
| Bahamians | 0.4 /100 | #277 | Tragic 1.5% |
| Hawaiians | 0.4 /100 | #278 | Tragic 1.5% |
| Marshallese | 0.4 /100 | #279 | Tragic 1.5% |
| Ecuadorians | 0.4 /100 | #280 | Tragic 1.5% |
| Tohono O'odham | 0.4 /100 | #281 | Tragic 1.5% |
| British West Indians | 0.3 /100 | #282 | Tragic 1.5% |
| Central Americans | 0.3 /100 | #283 | Tragic 1.5% |
| Jamaicans | 0.3 /100 | #284 | Tragic 1.5% |
| Malaysians | 0.3 /100 | #285 | Tragic 1.5% |
| Cherokee | 0.3 /100 | #286 | Tragic 1.5% |
| Cajuns | 0.3 /100 | #287 | Tragic 1.5% |