Immigrants from England vs Ecuadorian Doctorate Degree
COMPARE
Immigrants from England
Ecuadorian
Doctorate Degree
Doctorate Degree Comparison
Immigrants from England
Ecuadorians
2.2%
DOCTORATE DEGREE
99.6/ 100
METRIC RATING
84th/ 347
METRIC RANK
1.5%
DOCTORATE DEGREE
0.4/ 100
METRIC RATING
280th/ 347
METRIC RANK
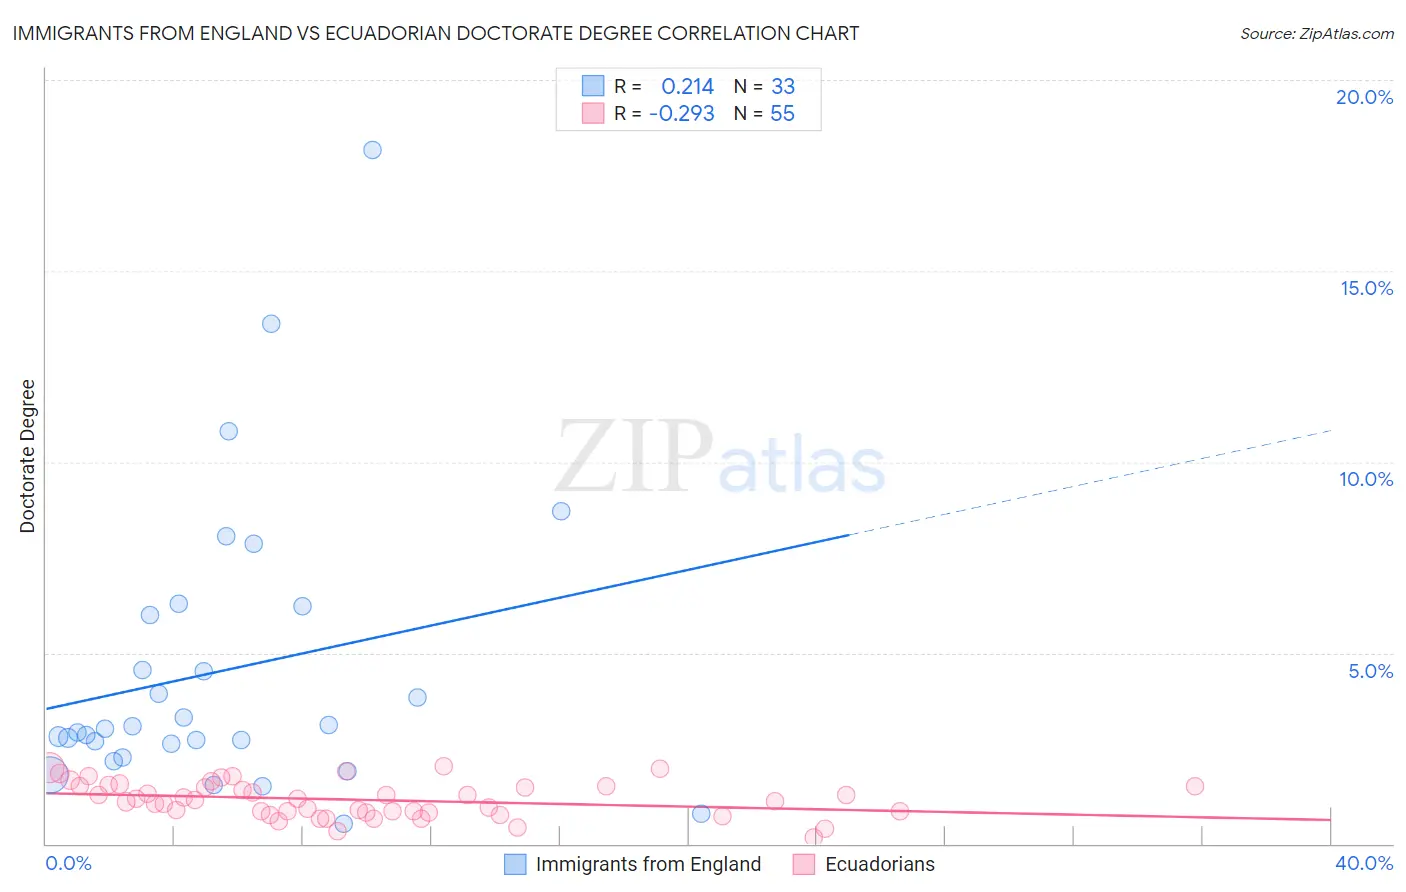
Immigrants from England vs Ecuadorian Doctorate Degree Correlation Chart
The statistical analysis conducted on geographies consisting of 388,548,002 people shows a weak positive correlation between the proportion of Immigrants from England and percentage of population with at least doctorate degree education in the United States with a correlation coefficient (R) of 0.214 and weighted average of 2.2%. Similarly, the statistical analysis conducted on geographies consisting of 316,205,329 people shows a weak negative correlation between the proportion of Ecuadorians and percentage of population with at least doctorate degree education in the United States with a correlation coefficient (R) of -0.293 and weighted average of 1.5%, a difference of 51.2%.
Doctorate Degree Correlation Summary
| Measurement | Immigrants from England | Ecuadorian |
| Minimum | 0.53% | 0.16% |
| Maximum | 18.2% | 2.0% |
| Range | 17.7% | 1.9% |
| Mean | 4.5% | 1.1% |
| Median | 3.0% | 1.2% |
| Interquartile 25% (IQ1) | 2.4% | 0.83% |
| Interquartile 75% (IQ3) | 6.1% | 1.5% |
| Interquartile Range (IQR) | 3.7% | 0.68% |
| Standard Deviation (Sample) | 3.8% | 0.46% |
| Standard Deviation (Population) | 3.8% | 0.45% |
Similar Demographics by Doctorate Degree
Demographics Similar to Immigrants from England by Doctorate Degree
In terms of doctorate degree, the demographic groups most similar to Immigrants from England are Immigrants from Brazil (2.2%, a difference of 0.13%), Immigrants from Lithuania (2.2%, a difference of 0.14%), Immigrants from Uganda (2.2%, a difference of 0.32%), Egyptian (2.2%, a difference of 0.83%), and Immigrants from Argentina (2.2%, a difference of 0.86%).
| Demographics | Rating | Rank | Doctorate Degree |
| Immigrants | Lebanon | 99.8 /100 | #77 | Exceptional 2.2% |
| Immigrants | Belarus | 99.7 /100 | #78 | Exceptional 2.2% |
| Northern Europeans | 99.7 /100 | #79 | Exceptional 2.2% |
| Ugandans | 99.7 /100 | #80 | Exceptional 2.2% |
| Immigrants | Argentina | 99.7 /100 | #81 | Exceptional 2.2% |
| Immigrants | Uganda | 99.6 /100 | #82 | Exceptional 2.2% |
| Immigrants | Lithuania | 99.6 /100 | #83 | Exceptional 2.2% |
| Immigrants | England | 99.6 /100 | #84 | Exceptional 2.2% |
| Immigrants | Brazil | 99.6 /100 | #85 | Exceptional 2.2% |
| Egyptians | 99.4 /100 | #86 | Exceptional 2.2% |
| Immigrants | Zimbabwe | 99.4 /100 | #87 | Exceptional 2.2% |
| Immigrants | Nepal | 99.3 /100 | #88 | Exceptional 2.2% |
| British | 99.3 /100 | #89 | Exceptional 2.2% |
| Immigrants | Scotland | 99.2 /100 | #90 | Exceptional 2.2% |
| Immigrants | Sudan | 99.1 /100 | #91 | Exceptional 2.2% |
Demographics Similar to Ecuadorians by Doctorate Degree
In terms of doctorate degree, the demographic groups most similar to Ecuadorians are Marshallese (1.5%, a difference of 0.010%), Tohono O'odham (1.5%, a difference of 0.060%), British West Indian (1.5%, a difference of 0.12%), Central American (1.5%, a difference of 0.16%), and Jamaican (1.5%, a difference of 0.20%).
| Demographics | Rating | Rank | Doctorate Degree |
| Sioux | 0.4 /100 | #273 | Tragic 1.5% |
| Yaqui | 0.4 /100 | #274 | Tragic 1.5% |
| Aleuts | 0.4 /100 | #275 | Tragic 1.5% |
| Paiute | 0.4 /100 | #276 | Tragic 1.5% |
| Bahamians | 0.4 /100 | #277 | Tragic 1.5% |
| Hawaiians | 0.4 /100 | #278 | Tragic 1.5% |
| Marshallese | 0.4 /100 | #279 | Tragic 1.5% |
| Ecuadorians | 0.4 /100 | #280 | Tragic 1.5% |
| Tohono O'odham | 0.4 /100 | #281 | Tragic 1.5% |
| British West Indians | 0.3 /100 | #282 | Tragic 1.5% |
| Central Americans | 0.3 /100 | #283 | Tragic 1.5% |
| Jamaicans | 0.3 /100 | #284 | Tragic 1.5% |
| Malaysians | 0.3 /100 | #285 | Tragic 1.5% |
| Cherokee | 0.3 /100 | #286 | Tragic 1.5% |
| Cajuns | 0.3 /100 | #287 | Tragic 1.5% |