Trinidadian and Tobagonian vs Immigrants from Uganda 6th Grade
COMPARE
Trinidadian and Tobagonian
Immigrants from Uganda
6th Grade
6th Grade Comparison
Trinidadians and Tobagonians
Immigrants from Uganda
96.2%
6TH GRADE
0.1/ 100
METRIC RATING
281st/ 347
METRIC RANK
96.9%
6TH GRADE
21.2/ 100
METRIC RATING
196th/ 347
METRIC RANK
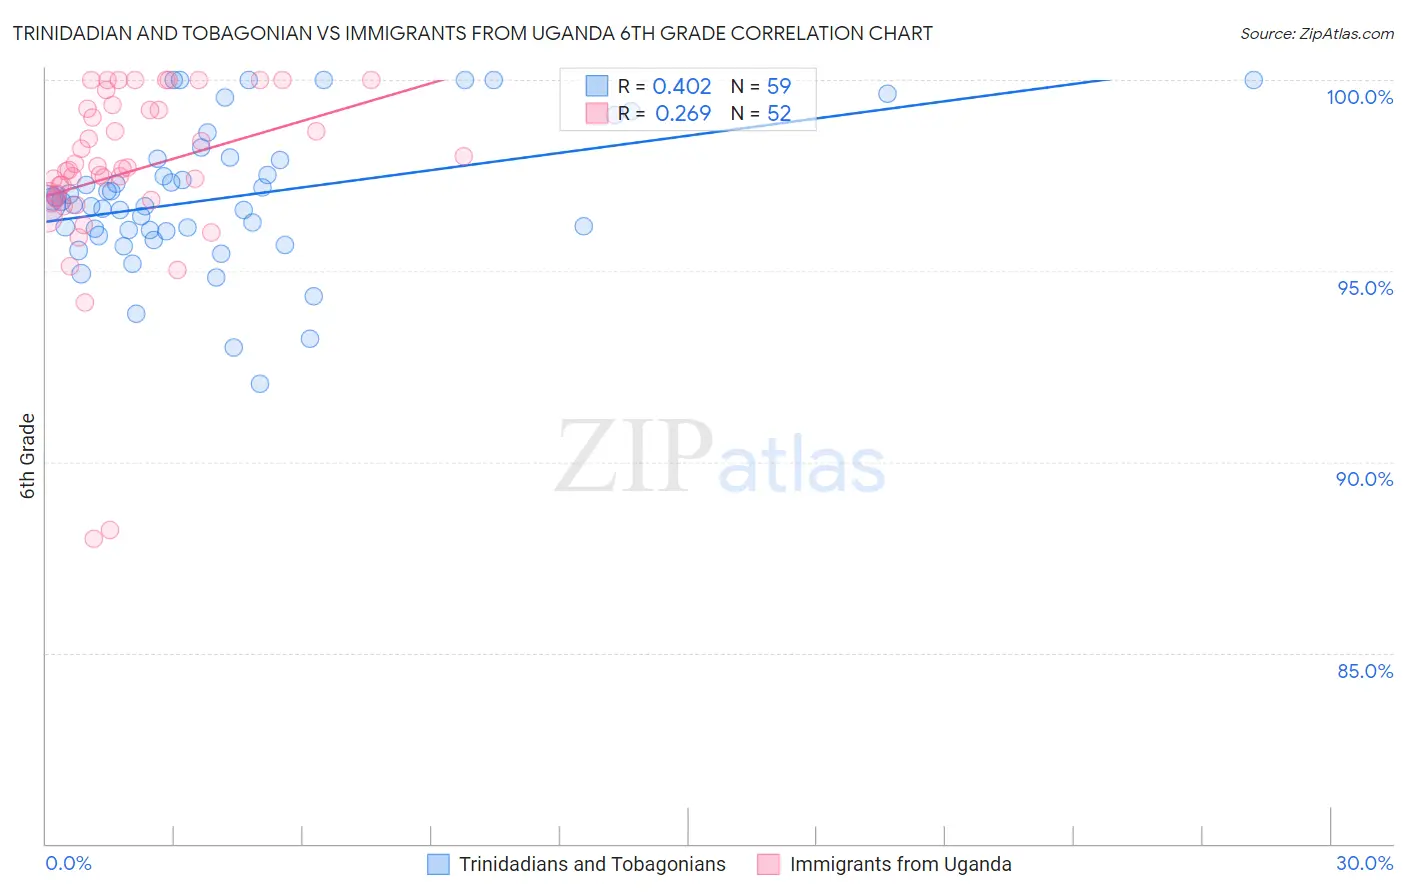
Trinidadian and Tobagonian vs Immigrants from Uganda 6th Grade Correlation Chart
The statistical analysis conducted on geographies consisting of 219,882,819 people shows a moderate positive correlation between the proportion of Trinidadians and Tobagonians and percentage of population with at least 6th grade education in the United States with a correlation coefficient (R) of 0.402 and weighted average of 96.2%. Similarly, the statistical analysis conducted on geographies consisting of 125,941,298 people shows a weak positive correlation between the proportion of Immigrants from Uganda and percentage of population with at least 6th grade education in the United States with a correlation coefficient (R) of 0.269 and weighted average of 96.9%, a difference of 0.69%.
6th Grade Correlation Summary
| Measurement | Trinidadian and Tobagonian | Immigrants from Uganda |
| Minimum | 92.1% | 88.0% |
| Maximum | 100.0% | 100.0% |
| Range | 7.9% | 12.0% |
| Mean | 96.9% | 97.6% |
| Median | 96.8% | 97.7% |
| Interquartile 25% (IQ1) | 96.0% | 96.9% |
| Interquartile 75% (IQ3) | 97.9% | 99.2% |
| Interquartile Range (IQR) | 1.9% | 2.4% |
| Standard Deviation (Sample) | 1.8% | 2.4% |
| Standard Deviation (Population) | 1.8% | 2.4% |
Similar Demographics by 6th Grade
Demographics Similar to Trinidadians and Tobagonians by 6th Grade
In terms of 6th grade, the demographic groups most similar to Trinidadians and Tobagonians are Immigrants from Peru (96.2%, a difference of 0.0%), Immigrants from Afghanistan (96.2%, a difference of 0.0%), Houma (96.2%, a difference of 0.0%), Cuban (96.2%, a difference of 0.010%), and Immigrants from Western Africa (96.3%, a difference of 0.020%).
| Demographics | Rating | Rank | 6th Grade |
| Immigrants | Philippines | 0.1 /100 | #274 | Tragic 96.3% |
| Immigrants | Ghana | 0.1 /100 | #275 | Tragic 96.3% |
| Yaqui | 0.1 /100 | #276 | Tragic 96.3% |
| Immigrants | Western Africa | 0.1 /100 | #277 | Tragic 96.3% |
| Immigrants | Thailand | 0.1 /100 | #278 | Tragic 96.3% |
| Immigrants | Peru | 0.1 /100 | #279 | Tragic 96.2% |
| Immigrants | Afghanistan | 0.1 /100 | #280 | Tragic 96.2% |
| Trinidadians and Tobagonians | 0.1 /100 | #281 | Tragic 96.2% |
| Houma | 0.1 /100 | #282 | Tragic 96.2% |
| Cubans | 0.1 /100 | #283 | Tragic 96.2% |
| Fijians | 0.1 /100 | #284 | Tragic 96.2% |
| Somalis | 0.1 /100 | #285 | Tragic 96.2% |
| Barbadians | 0.0 /100 | #286 | Tragic 96.2% |
| Immigrants | Trinidad and Tobago | 0.0 /100 | #287 | Tragic 96.2% |
| Malaysians | 0.0 /100 | #288 | Tragic 96.2% |
Demographics Similar to Immigrants from Uganda by 6th Grade
In terms of 6th grade, the demographic groups most similar to Immigrants from Uganda are Brazilian (96.9%, a difference of 0.010%), Immigrants from Albania (96.9%, a difference of 0.020%), Paraguayan (96.9%, a difference of 0.030%), Immigrants from Lebanon (96.9%, a difference of 0.030%), and Immigrants from Brazil (96.9%, a difference of 0.030%).
| Demographics | Rating | Rank | 6th Grade |
| Blacks/African Americans | 30.2 /100 | #189 | Fair 97.0% |
| Dutch West Indians | 28.3 /100 | #190 | Fair 96.9% |
| Panamanians | 27.3 /100 | #191 | Fair 96.9% |
| Hawaiians | 27.0 /100 | #192 | Fair 96.9% |
| Paraguayans | 26.6 /100 | #193 | Fair 96.9% |
| Immigrants | Lebanon | 25.6 /100 | #194 | Fair 96.9% |
| Immigrants | Brazil | 25.5 /100 | #195 | Fair 96.9% |
| Immigrants | Uganda | 21.2 /100 | #196 | Fair 96.9% |
| Brazilians | 20.1 /100 | #197 | Fair 96.9% |
| Immigrants | Albania | 18.8 /100 | #198 | Poor 96.9% |
| Immigrants | Northern Africa | 15.7 /100 | #199 | Poor 96.9% |
| Africans | 14.8 /100 | #200 | Poor 96.9% |
| Immigrants | Zaire | 14.5 /100 | #201 | Poor 96.9% |
| Immigrants | Chile | 14.2 /100 | #202 | Poor 96.8% |
| Sudanese | 13.9 /100 | #203 | Poor 96.8% |