Trinidadian and Tobagonian vs Immigrants from Oceania 6th Grade
COMPARE
Trinidadian and Tobagonian
Immigrants from Oceania
6th Grade
6th Grade Comparison
Trinidadians and Tobagonians
Immigrants from Oceania
96.2%
6TH GRADE
0.1/ 100
METRIC RATING
281st/ 347
METRIC RANK
96.8%
6TH GRADE
11.0/ 100
METRIC RATING
209th/ 347
METRIC RANK
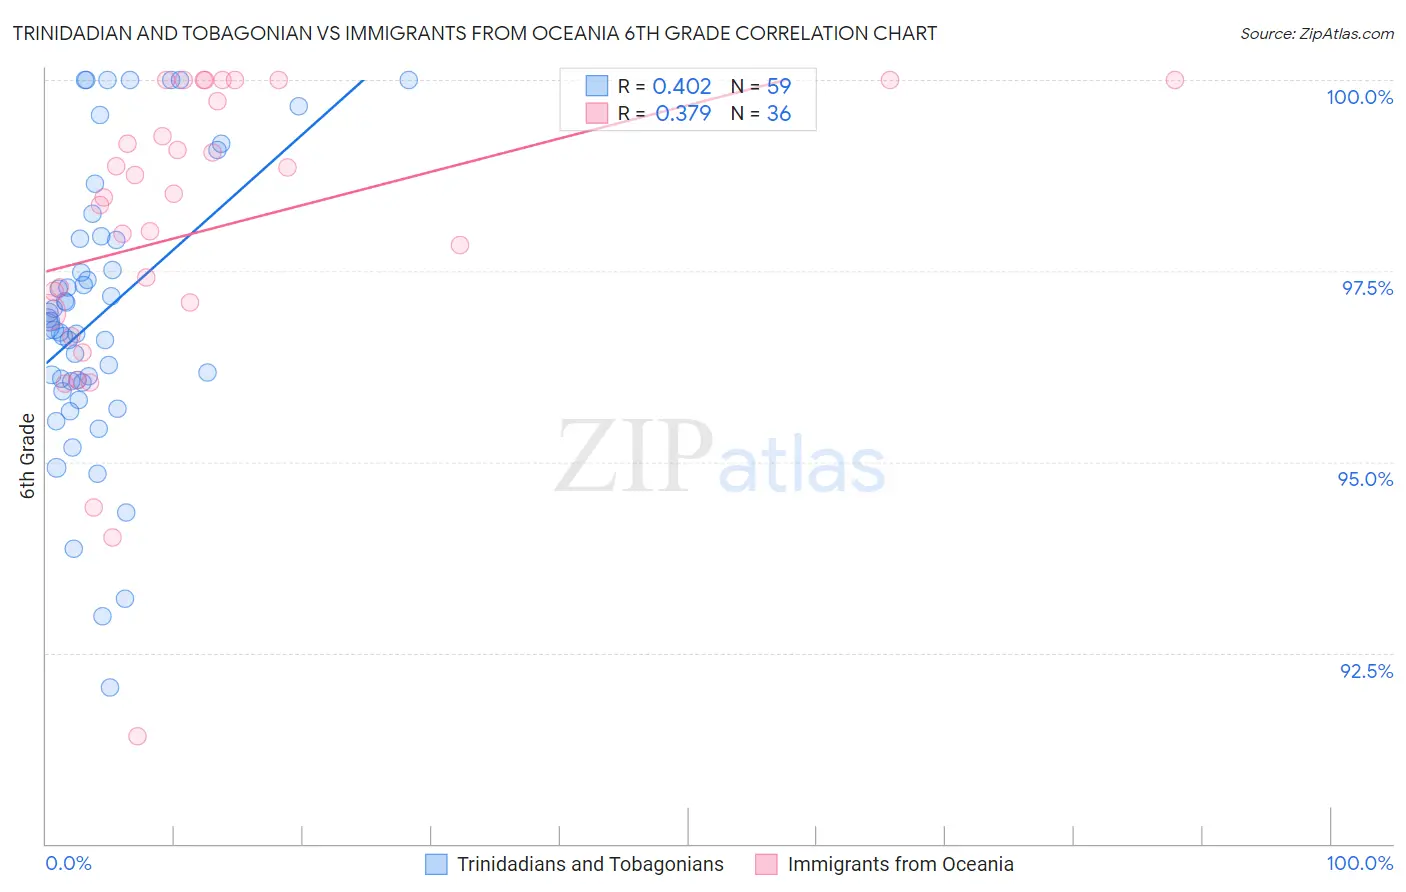
Trinidadian and Tobagonian vs Immigrants from Oceania 6th Grade Correlation Chart
The statistical analysis conducted on geographies consisting of 219,882,819 people shows a moderate positive correlation between the proportion of Trinidadians and Tobagonians and percentage of population with at least 6th grade education in the United States with a correlation coefficient (R) of 0.402 and weighted average of 96.2%. Similarly, the statistical analysis conducted on geographies consisting of 305,516,300 people shows a mild positive correlation between the proportion of Immigrants from Oceania and percentage of population with at least 6th grade education in the United States with a correlation coefficient (R) of 0.379 and weighted average of 96.8%, a difference of 0.60%.
6th Grade Correlation Summary
| Measurement | Trinidadian and Tobagonian | Immigrants from Oceania |
| Minimum | 92.1% | 91.4% |
| Maximum | 100.0% | 100.0% |
| Range | 7.9% | 8.6% |
| Mean | 96.9% | 98.0% |
| Median | 96.8% | 98.5% |
| Interquartile 25% (IQ1) | 96.0% | 97.0% |
| Interquartile 75% (IQ3) | 97.9% | 99.9% |
| Interquartile Range (IQR) | 1.9% | 2.8% |
| Standard Deviation (Sample) | 1.8% | 2.0% |
| Standard Deviation (Population) | 1.8% | 2.0% |
Similar Demographics by 6th Grade
Demographics Similar to Trinidadians and Tobagonians by 6th Grade
In terms of 6th grade, the demographic groups most similar to Trinidadians and Tobagonians are Immigrants from Peru (96.2%, a difference of 0.0%), Immigrants from Afghanistan (96.2%, a difference of 0.0%), Houma (96.2%, a difference of 0.0%), Cuban (96.2%, a difference of 0.010%), and Immigrants from Western Africa (96.3%, a difference of 0.020%).
| Demographics | Rating | Rank | 6th Grade |
| Immigrants | Philippines | 0.1 /100 | #274 | Tragic 96.3% |
| Immigrants | Ghana | 0.1 /100 | #275 | Tragic 96.3% |
| Yaqui | 0.1 /100 | #276 | Tragic 96.3% |
| Immigrants | Western Africa | 0.1 /100 | #277 | Tragic 96.3% |
| Immigrants | Thailand | 0.1 /100 | #278 | Tragic 96.3% |
| Immigrants | Peru | 0.1 /100 | #279 | Tragic 96.2% |
| Immigrants | Afghanistan | 0.1 /100 | #280 | Tragic 96.2% |
| Trinidadians and Tobagonians | 0.1 /100 | #281 | Tragic 96.2% |
| Houma | 0.1 /100 | #282 | Tragic 96.2% |
| Cubans | 0.1 /100 | #283 | Tragic 96.2% |
| Fijians | 0.1 /100 | #284 | Tragic 96.2% |
| Somalis | 0.1 /100 | #285 | Tragic 96.2% |
| Barbadians | 0.0 /100 | #286 | Tragic 96.2% |
| Immigrants | Trinidad and Tobago | 0.0 /100 | #287 | Tragic 96.2% |
| Malaysians | 0.0 /100 | #288 | Tragic 96.2% |
Demographics Similar to Immigrants from Oceania by 6th Grade
In terms of 6th grade, the demographic groups most similar to Immigrants from Oceania are Samoan (96.8%, a difference of 0.0%), Laotian (96.8%, a difference of 0.010%), Iraqi (96.8%, a difference of 0.010%), Immigrants from Nepal (96.8%, a difference of 0.010%), and Native/Alaskan (96.8%, a difference of 0.020%).
| Demographics | Rating | Rank | 6th Grade |
| Immigrants | Chile | 14.2 /100 | #202 | Poor 96.8% |
| Sudanese | 13.9 /100 | #203 | Poor 96.8% |
| Immigrants | Bahamas | 13.8 /100 | #204 | Poor 96.8% |
| Natives/Alaskans | 13.0 /100 | #205 | Poor 96.8% |
| Laotians | 11.8 /100 | #206 | Poor 96.8% |
| Iraqis | 11.7 /100 | #207 | Poor 96.8% |
| Samoans | 11.0 /100 | #208 | Poor 96.8% |
| Immigrants | Oceania | 11.0 /100 | #209 | Poor 96.8% |
| Immigrants | Nepal | 10.1 /100 | #210 | Poor 96.8% |
| Immigrants | Iraq | 9.2 /100 | #211 | Tragic 96.8% |
| Moroccans | 9.0 /100 | #212 | Tragic 96.8% |
| Immigrants | Sudan | 8.7 /100 | #213 | Tragic 96.8% |
| Portuguese | 8.2 /100 | #214 | Tragic 96.8% |
| Sierra Leoneans | 8.0 /100 | #215 | Tragic 96.8% |
| Paiute | 7.8 /100 | #216 | Tragic 96.8% |