Immigrants from Panama vs Immigrants from Uganda 6th Grade
COMPARE
Immigrants from Panama
Immigrants from Uganda
6th Grade
6th Grade Comparison
Immigrants from Panama
Immigrants from Uganda
96.7%
6TH GRADE
4.2/ 100
METRIC RATING
226th/ 347
METRIC RANK
96.9%
6TH GRADE
21.2/ 100
METRIC RATING
196th/ 347
METRIC RANK
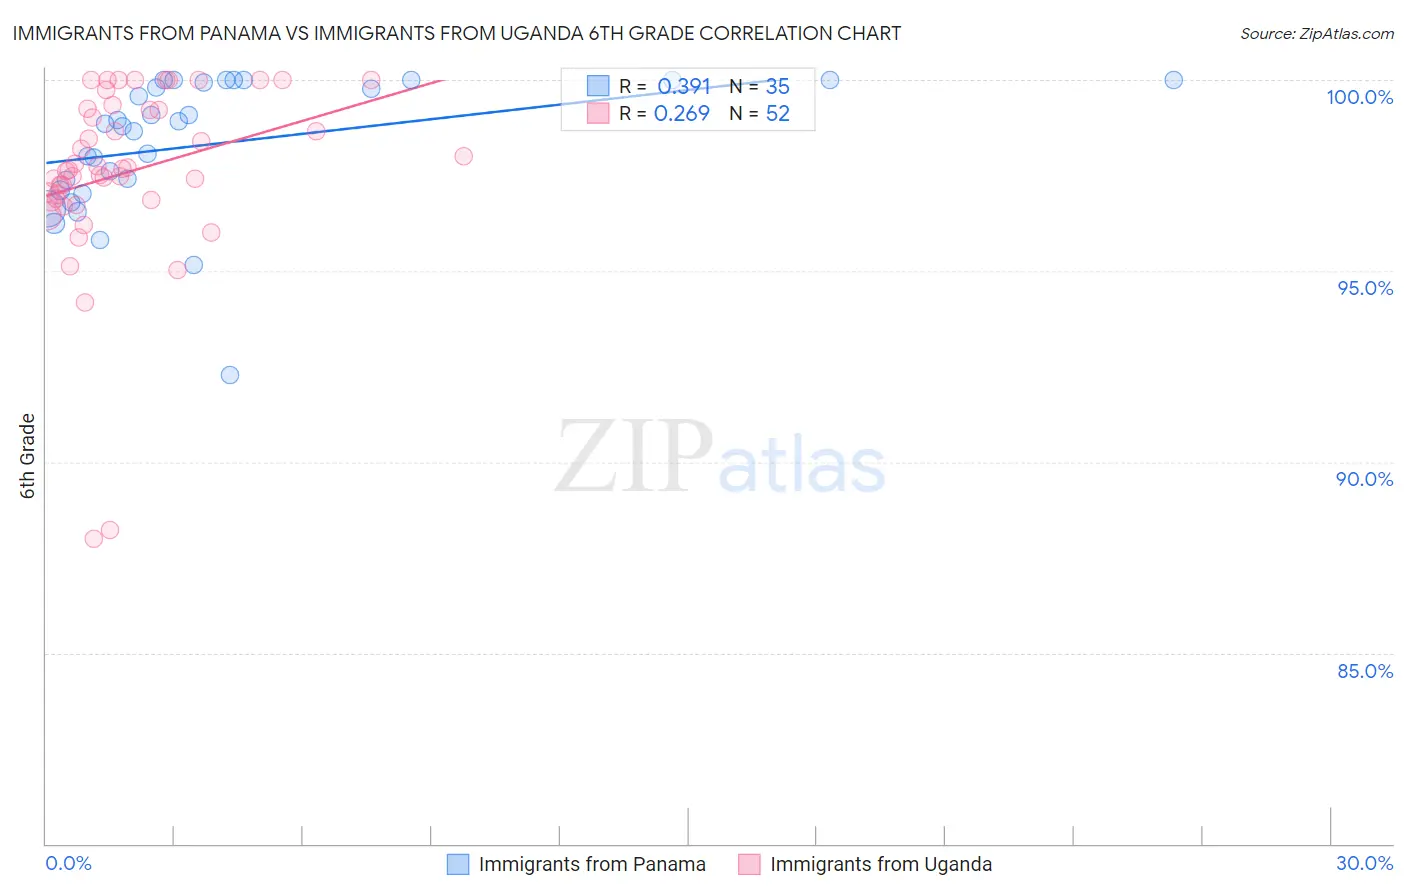
Immigrants from Panama vs Immigrants from Uganda 6th Grade Correlation Chart
The statistical analysis conducted on geographies consisting of 221,182,871 people shows a mild positive correlation between the proportion of Immigrants from Panama and percentage of population with at least 6th grade education in the United States with a correlation coefficient (R) of 0.391 and weighted average of 96.7%. Similarly, the statistical analysis conducted on geographies consisting of 125,941,298 people shows a weak positive correlation between the proportion of Immigrants from Uganda and percentage of population with at least 6th grade education in the United States with a correlation coefficient (R) of 0.269 and weighted average of 96.9%, a difference of 0.21%.
6th Grade Correlation Summary
| Measurement | Immigrants from Panama | Immigrants from Uganda |
| Minimum | 92.3% | 88.0% |
| Maximum | 100.0% | 100.0% |
| Range | 7.7% | 12.0% |
| Mean | 98.3% | 97.6% |
| Median | 98.9% | 97.7% |
| Interquartile 25% (IQ1) | 97.1% | 96.9% |
| Interquartile 75% (IQ3) | 100.0% | 99.2% |
| Interquartile Range (IQR) | 2.9% | 2.4% |
| Standard Deviation (Sample) | 1.8% | 2.4% |
| Standard Deviation (Population) | 1.8% | 2.4% |
Similar Demographics by 6th Grade
Demographics Similar to Immigrants from Panama by 6th Grade
In terms of 6th grade, the demographic groups most similar to Immigrants from Panama are Immigrants from Western Asia (96.7%, a difference of 0.0%), Immigrants from Malaysia (96.7%, a difference of 0.0%), Bahamian (96.7%, a difference of 0.010%), Immigrants from Southern Europe (96.7%, a difference of 0.010%), and Immigrants from Pakistan (96.7%, a difference of 0.010%).
| Demographics | Rating | Rank | 6th Grade |
| Costa Ricans | 6.8 /100 | #219 | Tragic 96.8% |
| Immigrants | Morocco | 6.2 /100 | #220 | Tragic 96.7% |
| Tongans | 6.1 /100 | #221 | Tragic 96.7% |
| Immigrants | Syria | 5.9 /100 | #222 | Tragic 96.7% |
| Bahamians | 4.8 /100 | #223 | Tragic 96.7% |
| Immigrants | Southern Europe | 4.4 /100 | #224 | Tragic 96.7% |
| Immigrants | Pakistan | 4.4 /100 | #225 | Tragic 96.7% |
| Immigrants | Panama | 4.2 /100 | #226 | Tragic 96.7% |
| Immigrants | Western Asia | 4.1 /100 | #227 | Tragic 96.7% |
| Immigrants | Malaysia | 4.0 /100 | #228 | Tragic 96.7% |
| Assyrians/Chaldeans/Syriacs | 4.0 /100 | #229 | Tragic 96.7% |
| Immigrants | Eastern Asia | 4.0 /100 | #230 | Tragic 96.7% |
| Sub-Saharan Africans | 3.5 /100 | #231 | Tragic 96.7% |
| South American Indians | 3.5 /100 | #232 | Tragic 96.7% |
| Yuman | 3.2 /100 | #233 | Tragic 96.7% |
Demographics Similar to Immigrants from Uganda by 6th Grade
In terms of 6th grade, the demographic groups most similar to Immigrants from Uganda are Brazilian (96.9%, a difference of 0.010%), Immigrants from Albania (96.9%, a difference of 0.020%), Paraguayan (96.9%, a difference of 0.030%), Immigrants from Lebanon (96.9%, a difference of 0.030%), and Immigrants from Brazil (96.9%, a difference of 0.030%).
| Demographics | Rating | Rank | 6th Grade |
| Blacks/African Americans | 30.2 /100 | #189 | Fair 97.0% |
| Dutch West Indians | 28.3 /100 | #190 | Fair 96.9% |
| Panamanians | 27.3 /100 | #191 | Fair 96.9% |
| Hawaiians | 27.0 /100 | #192 | Fair 96.9% |
| Paraguayans | 26.6 /100 | #193 | Fair 96.9% |
| Immigrants | Lebanon | 25.6 /100 | #194 | Fair 96.9% |
| Immigrants | Brazil | 25.5 /100 | #195 | Fair 96.9% |
| Immigrants | Uganda | 21.2 /100 | #196 | Fair 96.9% |
| Brazilians | 20.1 /100 | #197 | Fair 96.9% |
| Immigrants | Albania | 18.8 /100 | #198 | Poor 96.9% |
| Immigrants | Northern Africa | 15.7 /100 | #199 | Poor 96.9% |
| Africans | 14.8 /100 | #200 | Poor 96.9% |
| Immigrants | Zaire | 14.5 /100 | #201 | Poor 96.9% |
| Immigrants | Chile | 14.2 /100 | #202 | Poor 96.8% |
| Sudanese | 13.9 /100 | #203 | Poor 96.8% |