Trinidadian and Tobagonian vs Sri Lankan 6th Grade
COMPARE
Trinidadian and Tobagonian
Sri Lankan
6th Grade
6th Grade Comparison
Trinidadians and Tobagonians
Sri Lankans
96.2%
6TH GRADE
0.1/ 100
METRIC RATING
281st/ 347
METRIC RANK
95.8%
6TH GRADE
0.0/ 100
METRIC RATING
298th/ 347
METRIC RANK
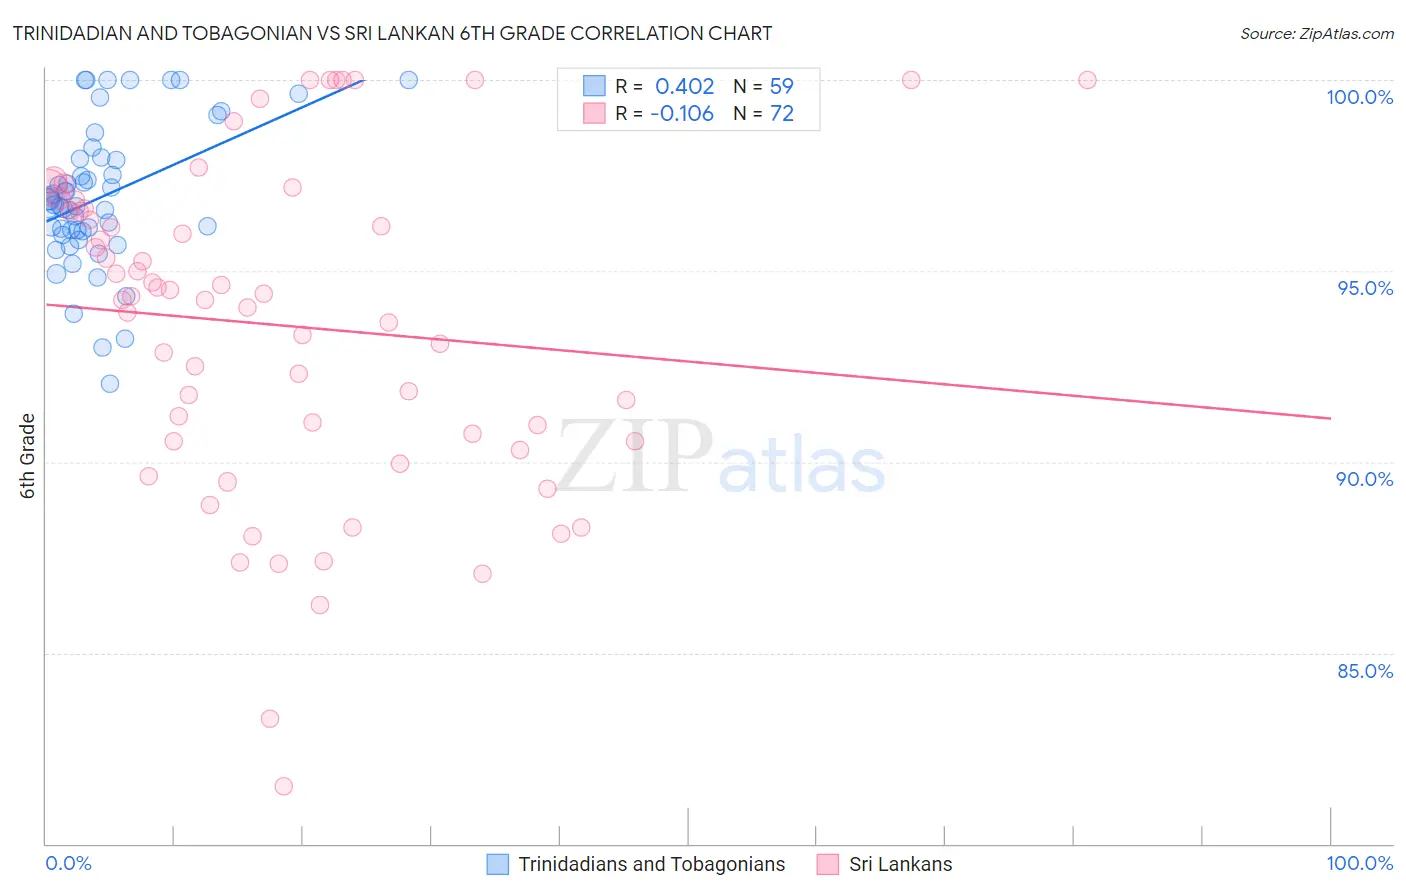
Trinidadian and Tobagonian vs Sri Lankan 6th Grade Correlation Chart
The statistical analysis conducted on geographies consisting of 219,882,819 people shows a moderate positive correlation between the proportion of Trinidadians and Tobagonians and percentage of population with at least 6th grade education in the United States with a correlation coefficient (R) of 0.402 and weighted average of 96.2%. Similarly, the statistical analysis conducted on geographies consisting of 440,593,746 people shows a poor negative correlation between the proportion of Sri Lankans and percentage of population with at least 6th grade education in the United States with a correlation coefficient (R) of -0.106 and weighted average of 95.8%, a difference of 0.50%.
6th Grade Correlation Summary
| Measurement | Trinidadian and Tobagonian | Sri Lankan |
| Minimum | 92.1% | 81.5% |
| Maximum | 100.0% | 100.0% |
| Range | 7.9% | 18.5% |
| Mean | 96.9% | 93.6% |
| Median | 96.8% | 94.3% |
| Interquartile 25% (IQ1) | 96.0% | 90.5% |
| Interquartile 75% (IQ3) | 97.9% | 96.6% |
| Interquartile Range (IQR) | 1.9% | 6.1% |
| Standard Deviation (Sample) | 1.8% | 4.3% |
| Standard Deviation (Population) | 1.8% | 4.3% |
Demographics Similar to Trinidadians and Tobagonians and Sri Lankans by 6th Grade
In terms of 6th grade, the demographic groups most similar to Trinidadians and Tobagonians are Immigrants from Peru (96.2%, a difference of 0.0%), Immigrants from Afghanistan (96.2%, a difference of 0.0%), Houma (96.2%, a difference of 0.0%), Cuban (96.2%, a difference of 0.010%), and Fijian (96.2%, a difference of 0.020%). Similarly, the demographic groups most similar to Sri Lankans are Immigrants from Laos (95.7%, a difference of 0.020%), Haitian (95.8%, a difference of 0.070%), Immigrants from South Eastern Asia (95.9%, a difference of 0.18%), Immigrants from Grenada (95.9%, a difference of 0.19%), and British West Indian (96.0%, a difference of 0.25%).
| Demographics | Rating | Rank | 6th Grade |
| Immigrants | Peru | 0.1 /100 | #279 | Tragic 96.2% |
| Immigrants | Afghanistan | 0.1 /100 | #280 | Tragic 96.2% |
| Trinidadians and Tobagonians | 0.1 /100 | #281 | Tragic 96.2% |
| Houma | 0.1 /100 | #282 | Tragic 96.2% |
| Cubans | 0.1 /100 | #283 | Tragic 96.2% |
| Fijians | 0.1 /100 | #284 | Tragic 96.2% |
| Somalis | 0.1 /100 | #285 | Tragic 96.2% |
| Barbadians | 0.0 /100 | #286 | Tragic 96.2% |
| Immigrants | Trinidad and Tobago | 0.0 /100 | #287 | Tragic 96.2% |
| Malaysians | 0.0 /100 | #288 | Tragic 96.2% |
| Immigrants | Eritrea | 0.0 /100 | #289 | Tragic 96.1% |
| Immigrants | Somalia | 0.0 /100 | #290 | Tragic 96.1% |
| Immigrants | St. Vincent and the Grenadines | 0.0 /100 | #291 | Tragic 96.1% |
| Immigrants | Barbados | 0.0 /100 | #292 | Tragic 96.1% |
| Immigrants | West Indies | 0.0 /100 | #293 | Tragic 96.1% |
| British West Indians | 0.0 /100 | #294 | Tragic 96.0% |
| Immigrants | Grenada | 0.0 /100 | #295 | Tragic 95.9% |
| Immigrants | South Eastern Asia | 0.0 /100 | #296 | Tragic 95.9% |
| Haitians | 0.0 /100 | #297 | Tragic 95.8% |
| Sri Lankans | 0.0 /100 | #298 | Tragic 95.8% |
| Immigrants | Laos | 0.0 /100 | #299 | Tragic 95.7% |