Japanese vs Immigrants from Uganda 6th Grade
COMPARE
Japanese
Immigrants from Uganda
6th Grade
6th Grade Comparison
Japanese
Immigrants from Uganda
95.4%
6TH GRADE
0.0/ 100
METRIC RATING
316th/ 347
METRIC RANK
96.9%
6TH GRADE
21.2/ 100
METRIC RATING
196th/ 347
METRIC RANK
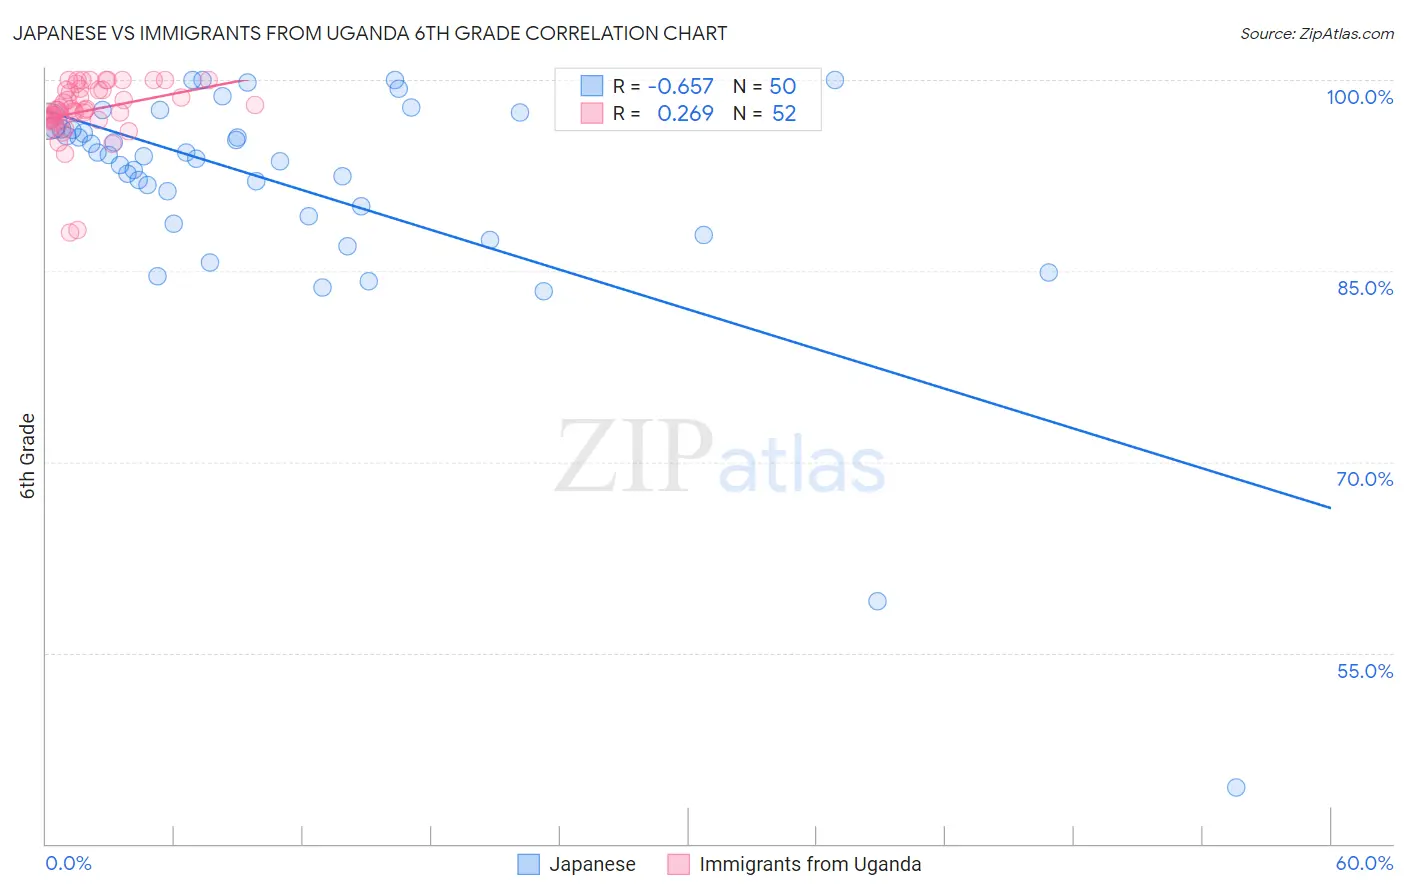
Japanese vs Immigrants from Uganda 6th Grade Correlation Chart
The statistical analysis conducted on geographies consisting of 249,183,224 people shows a significant negative correlation between the proportion of Japanese and percentage of population with at least 6th grade education in the United States with a correlation coefficient (R) of -0.657 and weighted average of 95.4%. Similarly, the statistical analysis conducted on geographies consisting of 125,941,298 people shows a weak positive correlation between the proportion of Immigrants from Uganda and percentage of population with at least 6th grade education in the United States with a correlation coefficient (R) of 0.269 and weighted average of 96.9%, a difference of 1.6%.
6th Grade Correlation Summary
| Measurement | Japanese | Immigrants from Uganda |
| Minimum | 44.4% | 88.0% |
| Maximum | 100.0% | 100.0% |
| Range | 55.6% | 12.0% |
| Mean | 91.7% | 97.6% |
| Median | 94.0% | 97.7% |
| Interquartile 25% (IQ1) | 89.3% | 96.9% |
| Interquartile 75% (IQ3) | 96.2% | 99.2% |
| Interquartile Range (IQR) | 6.9% | 2.4% |
| Standard Deviation (Sample) | 9.6% | 2.4% |
| Standard Deviation (Population) | 9.5% | 2.4% |
Similar Demographics by 6th Grade
Demographics Similar to Japanese by 6th Grade
In terms of 6th grade, the demographic groups most similar to Japanese are Immigrants from Bangladesh (95.4%, a difference of 0.010%), Immigrants from Vietnam (95.4%, a difference of 0.020%), Nicaraguan (95.4%, a difference of 0.030%), Vietnamese (95.3%, a difference of 0.030%), and Belizean (95.3%, a difference of 0.060%).
| Demographics | Rating | Rank | 6th Grade |
| Puerto Ricans | 0.0 /100 | #309 | Tragic 95.5% |
| Ecuadorians | 0.0 /100 | #310 | Tragic 95.5% |
| Immigrants | Portugal | 0.0 /100 | #311 | Tragic 95.5% |
| Immigrants | Guyana | 0.0 /100 | #312 | Tragic 95.5% |
| Nicaraguans | 0.0 /100 | #313 | Tragic 95.4% |
| Immigrants | Vietnam | 0.0 /100 | #314 | Tragic 95.4% |
| Immigrants | Bangladesh | 0.0 /100 | #315 | Tragic 95.4% |
| Japanese | 0.0 /100 | #316 | Tragic 95.4% |
| Vietnamese | 0.0 /100 | #317 | Tragic 95.3% |
| Belizeans | 0.0 /100 | #318 | Tragic 95.3% |
| Immigrants | Belize | 0.0 /100 | #319 | Tragic 95.3% |
| Immigrants | Ecuador | 0.0 /100 | #320 | Tragic 95.3% |
| Immigrants | Fiji | 0.0 /100 | #321 | Tragic 95.2% |
| Immigrants | Cambodia | 0.0 /100 | #322 | Tragic 95.2% |
| Central American Indians | 0.0 /100 | #323 | Tragic 95.1% |
Demographics Similar to Immigrants from Uganda by 6th Grade
In terms of 6th grade, the demographic groups most similar to Immigrants from Uganda are Brazilian (96.9%, a difference of 0.010%), Immigrants from Albania (96.9%, a difference of 0.020%), Paraguayan (96.9%, a difference of 0.030%), Immigrants from Lebanon (96.9%, a difference of 0.030%), and Immigrants from Brazil (96.9%, a difference of 0.030%).
| Demographics | Rating | Rank | 6th Grade |
| Blacks/African Americans | 30.2 /100 | #189 | Fair 97.0% |
| Dutch West Indians | 28.3 /100 | #190 | Fair 96.9% |
| Panamanians | 27.3 /100 | #191 | Fair 96.9% |
| Hawaiians | 27.0 /100 | #192 | Fair 96.9% |
| Paraguayans | 26.6 /100 | #193 | Fair 96.9% |
| Immigrants | Lebanon | 25.6 /100 | #194 | Fair 96.9% |
| Immigrants | Brazil | 25.5 /100 | #195 | Fair 96.9% |
| Immigrants | Uganda | 21.2 /100 | #196 | Fair 96.9% |
| Brazilians | 20.1 /100 | #197 | Fair 96.9% |
| Immigrants | Albania | 18.8 /100 | #198 | Poor 96.9% |
| Immigrants | Northern Africa | 15.7 /100 | #199 | Poor 96.9% |
| Africans | 14.8 /100 | #200 | Poor 96.9% |
| Immigrants | Zaire | 14.5 /100 | #201 | Poor 96.9% |
| Immigrants | Chile | 14.2 /100 | #202 | Poor 96.8% |
| Sudanese | 13.9 /100 | #203 | Poor 96.8% |