Dominican vs Immigrants from Uganda 6th Grade
COMPARE
Dominican
Immigrants from Uganda
6th Grade
6th Grade Comparison
Dominicans
Immigrants from Uganda
94.9%
6TH GRADE
0.0/ 100
METRIC RATING
329th/ 347
METRIC RANK
96.9%
6TH GRADE
21.2/ 100
METRIC RATING
196th/ 347
METRIC RANK
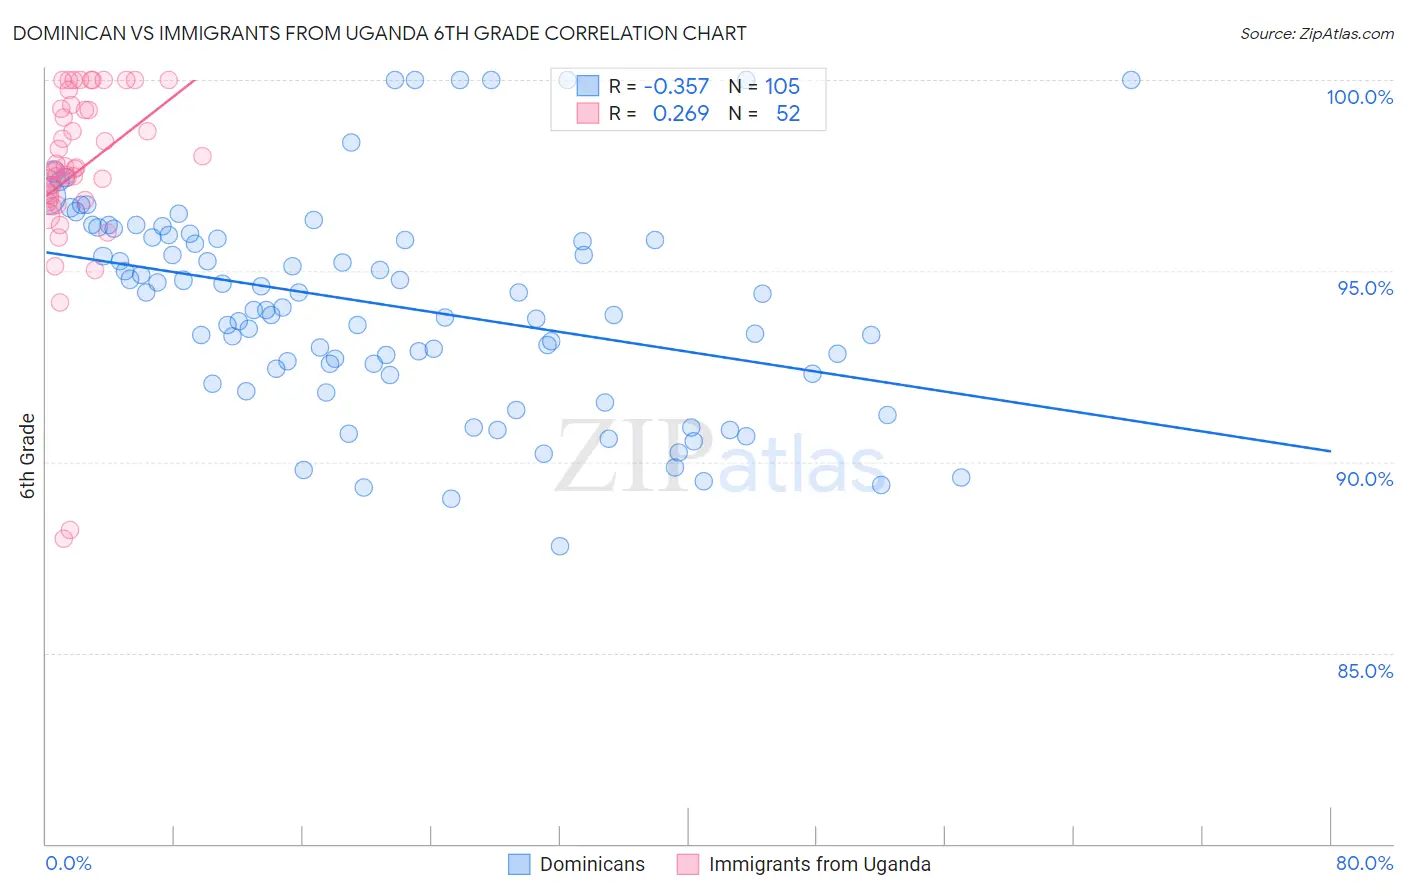
Dominican vs Immigrants from Uganda 6th Grade Correlation Chart
The statistical analysis conducted on geographies consisting of 355,142,603 people shows a mild negative correlation between the proportion of Dominicans and percentage of population with at least 6th grade education in the United States with a correlation coefficient (R) of -0.357 and weighted average of 94.9%. Similarly, the statistical analysis conducted on geographies consisting of 125,941,298 people shows a weak positive correlation between the proportion of Immigrants from Uganda and percentage of population with at least 6th grade education in the United States with a correlation coefficient (R) of 0.269 and weighted average of 96.9%, a difference of 2.1%.
6th Grade Correlation Summary
| Measurement | Dominican | Immigrants from Uganda |
| Minimum | 87.8% | 88.0% |
| Maximum | 100.0% | 100.0% |
| Range | 12.2% | 12.0% |
| Mean | 94.1% | 97.6% |
| Median | 94.0% | 97.7% |
| Interquartile 25% (IQ1) | 92.4% | 96.9% |
| Interquartile 75% (IQ3) | 95.9% | 99.2% |
| Interquartile Range (IQR) | 3.5% | 2.4% |
| Standard Deviation (Sample) | 2.7% | 2.4% |
| Standard Deviation (Population) | 2.7% | 2.4% |
Similar Demographics by 6th Grade
Demographics Similar to Dominicans by 6th Grade
In terms of 6th grade, the demographic groups most similar to Dominicans are Honduran (95.0%, a difference of 0.060%), Mexican American Indian (95.0%, a difference of 0.070%), Nepalese (94.9%, a difference of 0.070%), Immigrants from Armenia (94.9%, a difference of 0.080%), and Hispanic or Latino (95.0%, a difference of 0.10%).
| Demographics | Rating | Rank | 6th Grade |
| Immigrants | Cambodia | 0.0 /100 | #322 | Tragic 95.2% |
| Central American Indians | 0.0 /100 | #323 | Tragic 95.1% |
| Cape Verdeans | 0.0 /100 | #324 | Tragic 95.1% |
| Immigrants | Nicaragua | 0.0 /100 | #325 | Tragic 95.1% |
| Hispanics or Latinos | 0.0 /100 | #326 | Tragic 95.0% |
| Mexican American Indians | 0.0 /100 | #327 | Tragic 95.0% |
| Hondurans | 0.0 /100 | #328 | Tragic 95.0% |
| Dominicans | 0.0 /100 | #329 | Tragic 94.9% |
| Nepalese | 0.0 /100 | #330 | Tragic 94.9% |
| Immigrants | Armenia | 0.0 /100 | #331 | Tragic 94.9% |
| Immigrants | Honduras | 0.0 /100 | #332 | Tragic 94.8% |
| Immigrants | Latin America | 0.0 /100 | #333 | Tragic 94.7% |
| Immigrants | Azores | 0.0 /100 | #334 | Tragic 94.7% |
| Mexicans | 0.0 /100 | #335 | Tragic 94.6% |
| Immigrants | Dominican Republic | 0.0 /100 | #336 | Tragic 94.6% |
Demographics Similar to Immigrants from Uganda by 6th Grade
In terms of 6th grade, the demographic groups most similar to Immigrants from Uganda are Brazilian (96.9%, a difference of 0.010%), Immigrants from Albania (96.9%, a difference of 0.020%), Paraguayan (96.9%, a difference of 0.030%), Immigrants from Lebanon (96.9%, a difference of 0.030%), and Immigrants from Brazil (96.9%, a difference of 0.030%).
| Demographics | Rating | Rank | 6th Grade |
| Blacks/African Americans | 30.2 /100 | #189 | Fair 97.0% |
| Dutch West Indians | 28.3 /100 | #190 | Fair 96.9% |
| Panamanians | 27.3 /100 | #191 | Fair 96.9% |
| Hawaiians | 27.0 /100 | #192 | Fair 96.9% |
| Paraguayans | 26.6 /100 | #193 | Fair 96.9% |
| Immigrants | Lebanon | 25.6 /100 | #194 | Fair 96.9% |
| Immigrants | Brazil | 25.5 /100 | #195 | Fair 96.9% |
| Immigrants | Uganda | 21.2 /100 | #196 | Fair 96.9% |
| Brazilians | 20.1 /100 | #197 | Fair 96.9% |
| Immigrants | Albania | 18.8 /100 | #198 | Poor 96.9% |
| Immigrants | Northern Africa | 15.7 /100 | #199 | Poor 96.9% |
| Africans | 14.8 /100 | #200 | Poor 96.9% |
| Immigrants | Zaire | 14.5 /100 | #201 | Poor 96.9% |
| Immigrants | Chile | 14.2 /100 | #202 | Poor 96.8% |
| Sudanese | 13.9 /100 | #203 | Poor 96.8% |