Yup'ik vs Immigrants from Uganda 6th Grade
COMPARE
Yup'ik
Immigrants from Uganda
6th Grade
6th Grade Comparison
Yup'ik
Immigrants from Uganda
98.0%
6TH GRADE
100.0/ 100
METRIC RATING
27th/ 347
METRIC RANK
96.9%
6TH GRADE
21.2/ 100
METRIC RATING
196th/ 347
METRIC RANK
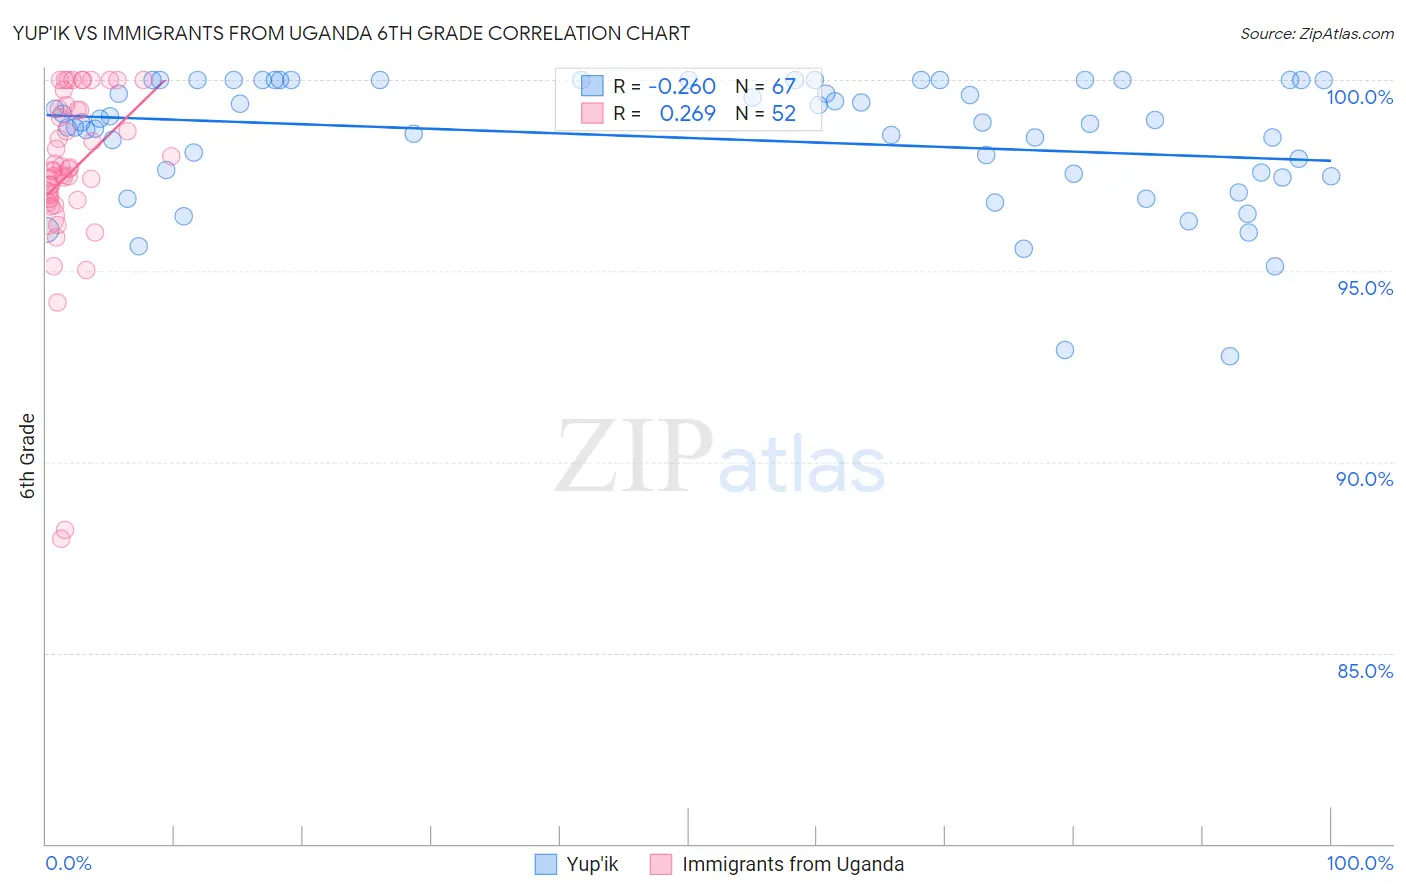
Yup'ik vs Immigrants from Uganda 6th Grade Correlation Chart
The statistical analysis conducted on geographies consisting of 39,963,824 people shows a weak negative correlation between the proportion of Yup'ik and percentage of population with at least 6th grade education in the United States with a correlation coefficient (R) of -0.260 and weighted average of 98.0%. Similarly, the statistical analysis conducted on geographies consisting of 125,941,298 people shows a weak positive correlation between the proportion of Immigrants from Uganda and percentage of population with at least 6th grade education in the United States with a correlation coefficient (R) of 0.269 and weighted average of 96.9%, a difference of 1.1%.
6th Grade Correlation Summary
| Measurement | Yup'ik | Immigrants from Uganda |
| Minimum | 92.8% | 88.0% |
| Maximum | 100.0% | 100.0% |
| Range | 7.2% | 12.0% |
| Mean | 98.5% | 97.6% |
| Median | 98.9% | 97.7% |
| Interquartile 25% (IQ1) | 97.6% | 96.9% |
| Interquartile 75% (IQ3) | 100.0% | 99.2% |
| Interquartile Range (IQR) | 2.4% | 2.4% |
| Standard Deviation (Sample) | 1.7% | 2.4% |
| Standard Deviation (Population) | 1.7% | 2.4% |
Similar Demographics by 6th Grade
Demographics Similar to Yup'ik by 6th Grade
In terms of 6th grade, the demographic groups most similar to Yup'ik are Czech (98.0%, a difference of 0.0%), Scandinavian (98.0%, a difference of 0.0%), French (98.0%, a difference of 0.0%), French Canadian (98.0%, a difference of 0.010%), and Scotch-Irish (98.0%, a difference of 0.020%).
| Demographics | Rating | Rank | 6th Grade |
| Finns | 100.0 /100 | #20 | Exceptional 98.1% |
| Lithuanians | 100.0 /100 | #21 | Exceptional 98.1% |
| Danes | 100.0 /100 | #22 | Exceptional 98.0% |
| Sioux | 100.0 /100 | #23 | Exceptional 98.0% |
| Croatians | 100.0 /100 | #24 | Exceptional 98.0% |
| Scotch-Irish | 100.0 /100 | #25 | Exceptional 98.0% |
| Czechs | 100.0 /100 | #26 | Exceptional 98.0% |
| Yup'ik | 100.0 /100 | #27 | Exceptional 98.0% |
| Scandinavians | 100.0 /100 | #28 | Exceptional 98.0% |
| French | 100.0 /100 | #29 | Exceptional 98.0% |
| French Canadians | 100.0 /100 | #30 | Exceptional 98.0% |
| Europeans | 100.0 /100 | #31 | Exceptional 98.0% |
| Alaska Natives | 100.0 /100 | #32 | Exceptional 98.0% |
| Chippewa | 100.0 /100 | #33 | Exceptional 97.9% |
| Swiss | 100.0 /100 | #34 | Exceptional 97.9% |
Demographics Similar to Immigrants from Uganda by 6th Grade
In terms of 6th grade, the demographic groups most similar to Immigrants from Uganda are Brazilian (96.9%, a difference of 0.010%), Immigrants from Albania (96.9%, a difference of 0.020%), Paraguayan (96.9%, a difference of 0.030%), Immigrants from Lebanon (96.9%, a difference of 0.030%), and Immigrants from Brazil (96.9%, a difference of 0.030%).
| Demographics | Rating | Rank | 6th Grade |
| Blacks/African Americans | 30.2 /100 | #189 | Fair 97.0% |
| Dutch West Indians | 28.3 /100 | #190 | Fair 96.9% |
| Panamanians | 27.3 /100 | #191 | Fair 96.9% |
| Hawaiians | 27.0 /100 | #192 | Fair 96.9% |
| Paraguayans | 26.6 /100 | #193 | Fair 96.9% |
| Immigrants | Lebanon | 25.6 /100 | #194 | Fair 96.9% |
| Immigrants | Brazil | 25.5 /100 | #195 | Fair 96.9% |
| Immigrants | Uganda | 21.2 /100 | #196 | Fair 96.9% |
| Brazilians | 20.1 /100 | #197 | Fair 96.9% |
| Immigrants | Albania | 18.8 /100 | #198 | Poor 96.9% |
| Immigrants | Northern Africa | 15.7 /100 | #199 | Poor 96.9% |
| Africans | 14.8 /100 | #200 | Poor 96.9% |
| Immigrants | Zaire | 14.5 /100 | #201 | Poor 96.9% |
| Immigrants | Chile | 14.2 /100 | #202 | Poor 96.8% |
| Sudanese | 13.9 /100 | #203 | Poor 96.8% |