Trinidadian and Tobagonian vs Guyanese 6th Grade
COMPARE
Trinidadian and Tobagonian
Guyanese
6th Grade
6th Grade Comparison
Trinidadians and Tobagonians
Guyanese
96.2%
6TH GRADE
0.1/ 100
METRIC RATING
281st/ 347
METRIC RANK
95.6%
6TH GRADE
0.0/ 100
METRIC RATING
307th/ 347
METRIC RANK
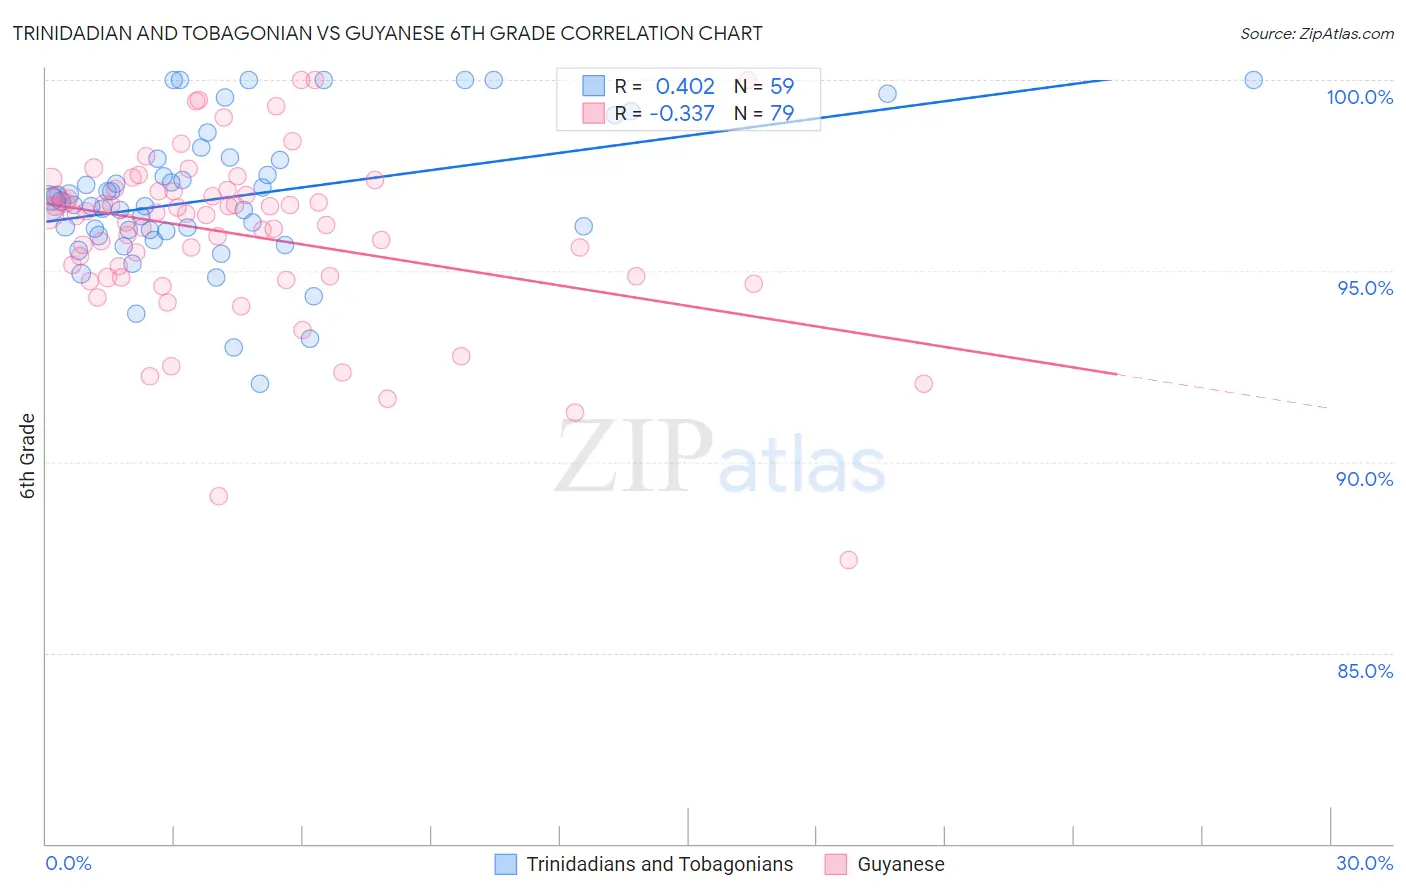
Trinidadian and Tobagonian vs Guyanese 6th Grade Correlation Chart
The statistical analysis conducted on geographies consisting of 219,882,819 people shows a moderate positive correlation between the proportion of Trinidadians and Tobagonians and percentage of population with at least 6th grade education in the United States with a correlation coefficient (R) of 0.402 and weighted average of 96.2%. Similarly, the statistical analysis conducted on geographies consisting of 176,921,765 people shows a mild negative correlation between the proportion of Guyanese and percentage of population with at least 6th grade education in the United States with a correlation coefficient (R) of -0.337 and weighted average of 95.6%, a difference of 0.71%.
6th Grade Correlation Summary
| Measurement | Trinidadian and Tobagonian | Guyanese |
| Minimum | 92.1% | 87.4% |
| Maximum | 100.0% | 100.0% |
| Range | 7.9% | 12.6% |
| Mean | 96.9% | 96.0% |
| Median | 96.8% | 96.5% |
| Interquartile 25% (IQ1) | 96.0% | 94.9% |
| Interquartile 75% (IQ3) | 97.9% | 97.1% |
| Interquartile Range (IQR) | 1.9% | 2.2% |
| Standard Deviation (Sample) | 1.8% | 2.3% |
| Standard Deviation (Population) | 1.8% | 2.2% |
Similar Demographics by 6th Grade
Demographics Similar to Trinidadians and Tobagonians by 6th Grade
In terms of 6th grade, the demographic groups most similar to Trinidadians and Tobagonians are Immigrants from Peru (96.2%, a difference of 0.0%), Immigrants from Afghanistan (96.2%, a difference of 0.0%), Houma (96.2%, a difference of 0.0%), Cuban (96.2%, a difference of 0.010%), and Immigrants from Western Africa (96.3%, a difference of 0.020%).
| Demographics | Rating | Rank | 6th Grade |
| Immigrants | Philippines | 0.1 /100 | #274 | Tragic 96.3% |
| Immigrants | Ghana | 0.1 /100 | #275 | Tragic 96.3% |
| Yaqui | 0.1 /100 | #276 | Tragic 96.3% |
| Immigrants | Western Africa | 0.1 /100 | #277 | Tragic 96.3% |
| Immigrants | Thailand | 0.1 /100 | #278 | Tragic 96.3% |
| Immigrants | Peru | 0.1 /100 | #279 | Tragic 96.2% |
| Immigrants | Afghanistan | 0.1 /100 | #280 | Tragic 96.2% |
| Trinidadians and Tobagonians | 0.1 /100 | #281 | Tragic 96.2% |
| Houma | 0.1 /100 | #282 | Tragic 96.2% |
| Cubans | 0.1 /100 | #283 | Tragic 96.2% |
| Fijians | 0.1 /100 | #284 | Tragic 96.2% |
| Somalis | 0.1 /100 | #285 | Tragic 96.2% |
| Barbadians | 0.0 /100 | #286 | Tragic 96.2% |
| Immigrants | Trinidad and Tobago | 0.0 /100 | #287 | Tragic 96.2% |
| Malaysians | 0.0 /100 | #288 | Tragic 96.2% |
Demographics Similar to Guyanese by 6th Grade
In terms of 6th grade, the demographic groups most similar to Guyanese are Immigrants from Caribbean (95.6%, a difference of 0.010%), Immigrants from Haiti (95.6%, a difference of 0.020%), Immigrants from Cuba (95.6%, a difference of 0.060%), Puerto Rican (95.5%, a difference of 0.060%), and Ecuadorian (95.5%, a difference of 0.070%).
| Demographics | Rating | Rank | 6th Grade |
| Immigrants | Dominica | 0.0 /100 | #300 | Tragic 95.7% |
| Immigrants | Immigrants | 0.0 /100 | #301 | Tragic 95.7% |
| Immigrants | Burma/Myanmar | 0.0 /100 | #302 | Tragic 95.7% |
| Bangladeshis | 0.0 /100 | #303 | Tragic 95.7% |
| Indonesians | 0.0 /100 | #304 | Tragic 95.6% |
| Immigrants | Cuba | 0.0 /100 | #305 | Tragic 95.6% |
| Immigrants | Haiti | 0.0 /100 | #306 | Tragic 95.6% |
| Guyanese | 0.0 /100 | #307 | Tragic 95.6% |
| Immigrants | Caribbean | 0.0 /100 | #308 | Tragic 95.6% |
| Puerto Ricans | 0.0 /100 | #309 | Tragic 95.5% |
| Ecuadorians | 0.0 /100 | #310 | Tragic 95.5% |
| Immigrants | Portugal | 0.0 /100 | #311 | Tragic 95.5% |
| Immigrants | Guyana | 0.0 /100 | #312 | Tragic 95.5% |
| Nicaraguans | 0.0 /100 | #313 | Tragic 95.4% |
| Immigrants | Vietnam | 0.0 /100 | #314 | Tragic 95.4% |