Tongan vs Immigrants from Iran 10th Grade
COMPARE
Tongan
Immigrants from Iran
10th Grade
10th Grade Comparison
Tongans
Immigrants from Iran
93.3%
10TH GRADE
9.5/ 100
METRIC RATING
220th/ 347
METRIC RANK
94.3%
10TH GRADE
94.4/ 100
METRIC RATING
126th/ 347
METRIC RANK
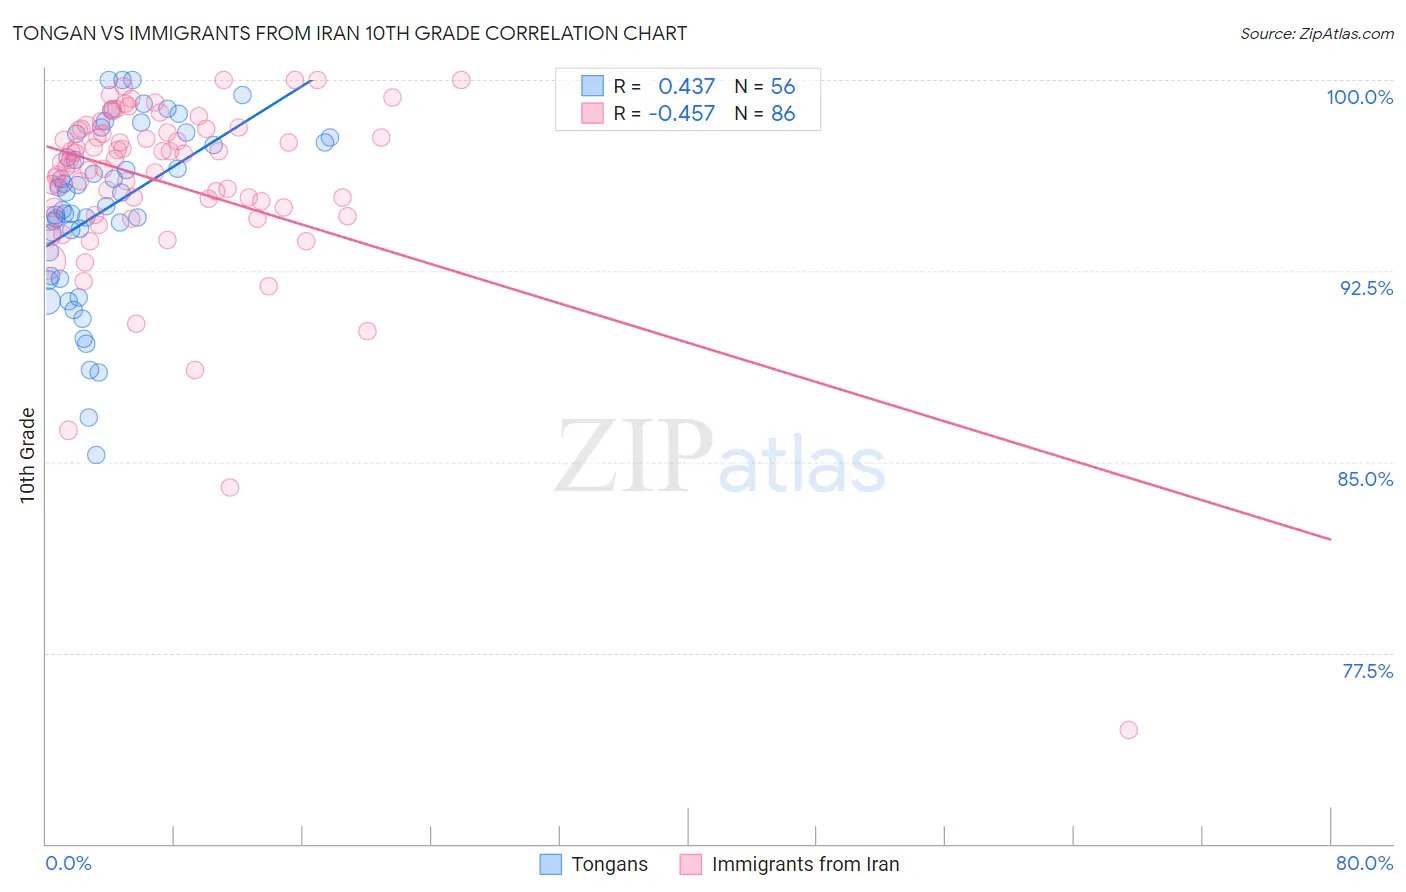
Tongan vs Immigrants from Iran 10th Grade Correlation Chart
The statistical analysis conducted on geographies consisting of 102,873,790 people shows a moderate positive correlation between the proportion of Tongans and percentage of population with at least 10th grade education in the United States with a correlation coefficient (R) of 0.437 and weighted average of 93.3%. Similarly, the statistical analysis conducted on geographies consisting of 279,867,553 people shows a moderate negative correlation between the proportion of Immigrants from Iran and percentage of population with at least 10th grade education in the United States with a correlation coefficient (R) of -0.457 and weighted average of 94.3%, a difference of 1.1%.
10th Grade Correlation Summary
| Measurement | Tongan | Immigrants from Iran |
| Minimum | 85.3% | 74.5% |
| Maximum | 100.0% | 100.0% |
| Range | 14.7% | 25.5% |
| Mean | 94.9% | 96.0% |
| Median | 95.3% | 96.8% |
| Interquartile 25% (IQ1) | 92.8% | 95.0% |
| Interquartile 75% (IQ3) | 97.7% | 98.0% |
| Interquartile Range (IQR) | 4.9% | 3.0% |
| Standard Deviation (Sample) | 3.4% | 3.7% |
| Standard Deviation (Population) | 3.4% | 3.7% |
Similar Demographics by 10th Grade
Demographics Similar to Tongans by 10th Grade
In terms of 10th grade, the demographic groups most similar to Tongans are Immigrants from Liberia (93.3%, a difference of 0.020%), Seminole (93.3%, a difference of 0.020%), Immigrants from Southern Europe (93.2%, a difference of 0.020%), Ethiopian (93.2%, a difference of 0.050%), and Immigrants from Sierra Leone (93.2%, a difference of 0.050%).
| Demographics | Rating | Rank | 10th Grade |
| Immigrants | Asia | 15.7 /100 | #213 | Poor 93.4% |
| Immigrants | Bahamas | 15.2 /100 | #214 | Poor 93.4% |
| Immigrants | Oceania | 15.1 /100 | #215 | Poor 93.4% |
| Immigrants | Eastern Africa | 14.7 /100 | #216 | Poor 93.4% |
| Portuguese | 12.1 /100 | #217 | Poor 93.3% |
| Immigrants | Liberia | 10.2 /100 | #218 | Poor 93.3% |
| Seminole | 10.2 /100 | #219 | Poor 93.3% |
| Tongans | 9.5 /100 | #220 | Tragic 93.3% |
| Immigrants | Southern Europe | 8.9 /100 | #221 | Tragic 93.2% |
| Ethiopians | 7.9 /100 | #222 | Tragic 93.2% |
| Immigrants | Sierra Leone | 7.6 /100 | #223 | Tragic 93.2% |
| Bolivians | 6.7 /100 | #224 | Tragic 93.2% |
| Somalis | 6.2 /100 | #225 | Tragic 93.2% |
| Koreans | 6.1 /100 | #226 | Tragic 93.2% |
| Blacks/African Americans | 6.0 /100 | #227 | Tragic 93.2% |
Demographics Similar to Immigrants from Iran by 10th Grade
In terms of 10th grade, the demographic groups most similar to Immigrants from Iran are American (94.3%, a difference of 0.0%), Basque (94.3%, a difference of 0.020%), Israeli (94.3%, a difference of 0.020%), Inupiat (94.4%, a difference of 0.030%), and Cree (94.4%, a difference of 0.030%).
| Demographics | Rating | Rank | 10th Grade |
| Immigrants | Israel | 95.4 /100 | #119 | Exceptional 94.4% |
| Immigrants | Taiwan | 95.3 /100 | #120 | Exceptional 94.4% |
| Immigrants | Belarus | 95.2 /100 | #121 | Exceptional 94.4% |
| Inupiat | 95.1 /100 | #122 | Exceptional 94.4% |
| Cree | 95.1 /100 | #123 | Exceptional 94.4% |
| Basques | 94.9 /100 | #124 | Exceptional 94.3% |
| Americans | 94.4 /100 | #125 | Exceptional 94.3% |
| Immigrants | Iran | 94.4 /100 | #126 | Exceptional 94.3% |
| Israelis | 93.8 /100 | #127 | Exceptional 94.3% |
| Potawatomi | 93.6 /100 | #128 | Exceptional 94.3% |
| Iroquois | 92.8 /100 | #129 | Exceptional 94.3% |
| Immigrants | Greece | 92.7 /100 | #130 | Exceptional 94.3% |
| Immigrants | Eastern Europe | 92.5 /100 | #131 | Exceptional 94.3% |
| Immigrants | Russia | 92.4 /100 | #132 | Exceptional 94.3% |
| Creek | 91.9 /100 | #133 | Exceptional 94.2% |