Serbian vs Immigrants from Zimbabwe 10th Grade
COMPARE
Serbian
Immigrants from Zimbabwe
10th Grade
10th Grade Comparison
Serbians
Immigrants from Zimbabwe
95.1%
10TH GRADE
99.9/ 100
METRIC RATING
47th/ 347
METRIC RANK
94.4%
10TH GRADE
96.8/ 100
METRIC RATING
111th/ 347
METRIC RANK
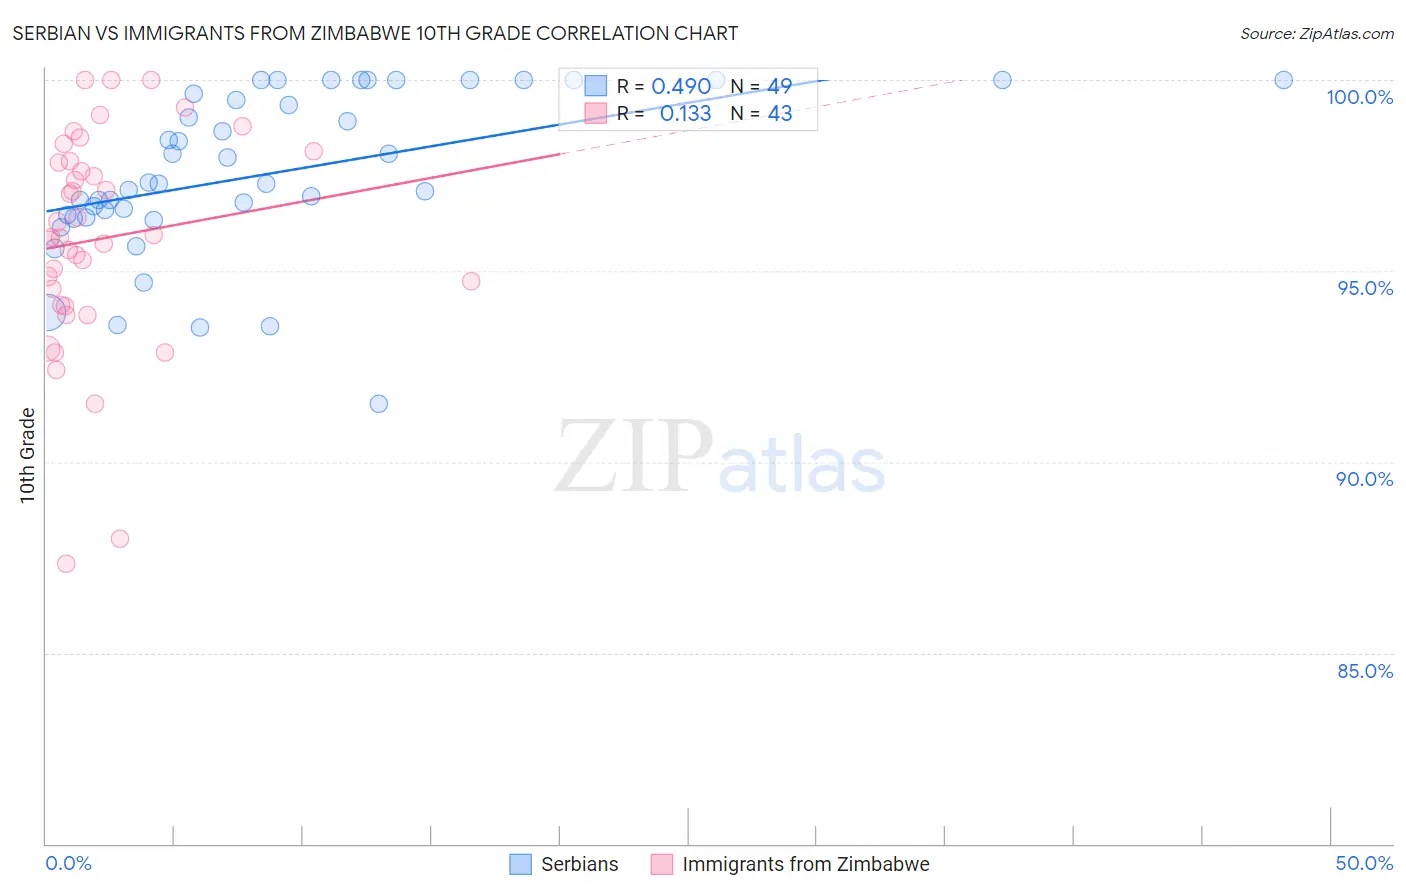
Serbian vs Immigrants from Zimbabwe 10th Grade Correlation Chart
The statistical analysis conducted on geographies consisting of 267,640,774 people shows a moderate positive correlation between the proportion of Serbians and percentage of population with at least 10th grade education in the United States with a correlation coefficient (R) of 0.490 and weighted average of 95.1%. Similarly, the statistical analysis conducted on geographies consisting of 117,809,691 people shows a poor positive correlation between the proportion of Immigrants from Zimbabwe and percentage of population with at least 10th grade education in the United States with a correlation coefficient (R) of 0.133 and weighted average of 94.4%, a difference of 0.73%.
10th Grade Correlation Summary
| Measurement | Serbian | Immigrants from Zimbabwe |
| Minimum | 91.5% | 87.3% |
| Maximum | 100.0% | 100.0% |
| Range | 8.5% | 12.7% |
| Mean | 97.6% | 95.8% |
| Median | 97.3% | 95.9% |
| Interquartile 25% (IQ1) | 96.4% | 94.1% |
| Interquartile 75% (IQ3) | 99.8% | 97.9% |
| Interquartile Range (IQR) | 3.4% | 3.8% |
| Standard Deviation (Sample) | 2.1% | 2.8% |
| Standard Deviation (Population) | 2.1% | 2.8% |
Similar Demographics by 10th Grade
Demographics Similar to Serbians by 10th Grade
In terms of 10th grade, the demographic groups most similar to Serbians are Czechoslovakian (95.1%, a difference of 0.010%), Immigrants from Northern Europe (95.2%, a difference of 0.020%), Greek (95.2%, a difference of 0.020%), Australian (95.1%, a difference of 0.020%), and Macedonian (95.2%, a difference of 0.030%).
| Demographics | Rating | Rank | 10th Grade |
| Scotch-Irish | 99.9 /100 | #40 | Exceptional 95.2% |
| Russians | 99.9 /100 | #41 | Exceptional 95.2% |
| Slavs | 99.9 /100 | #42 | Exceptional 95.2% |
| Macedonians | 99.9 /100 | #43 | Exceptional 95.2% |
| Immigrants | Northern Europe | 99.9 /100 | #44 | Exceptional 95.2% |
| Greeks | 99.9 /100 | #45 | Exceptional 95.2% |
| Czechoslovakians | 99.9 /100 | #46 | Exceptional 95.1% |
| Serbians | 99.9 /100 | #47 | Exceptional 95.1% |
| Australians | 99.9 /100 | #48 | Exceptional 95.1% |
| Immigrants | Austria | 99.9 /100 | #49 | Exceptional 95.1% |
| Immigrants | Canada | 99.8 /100 | #50 | Exceptional 95.1% |
| Austrians | 99.8 /100 | #51 | Exceptional 95.1% |
| Ottawa | 99.8 /100 | #52 | Exceptional 95.1% |
| Immigrants | North America | 99.8 /100 | #53 | Exceptional 95.0% |
| Immigrants | Lithuania | 99.8 /100 | #54 | Exceptional 95.0% |
Demographics Similar to Immigrants from Zimbabwe by 10th Grade
In terms of 10th grade, the demographic groups most similar to Immigrants from Zimbabwe are Immigrants from Kuwait (94.4%, a difference of 0.010%), Burmese (94.5%, a difference of 0.020%), Palestinian (94.4%, a difference of 0.020%), Immigrants from North Macedonia (94.5%, a difference of 0.030%), and Immigrants from Norway (94.5%, a difference of 0.030%).
| Demographics | Rating | Rank | 10th Grade |
| Immigrants | Romania | 97.5 /100 | #104 | Exceptional 94.5% |
| Immigrants | Turkey | 97.4 /100 | #105 | Exceptional 94.5% |
| Immigrants | Serbia | 97.4 /100 | #106 | Exceptional 94.5% |
| Immigrants | Croatia | 97.4 /100 | #107 | Exceptional 94.5% |
| Immigrants | North Macedonia | 97.2 /100 | #108 | Exceptional 94.5% |
| Immigrants | Norway | 97.2 /100 | #109 | Exceptional 94.5% |
| Burmese | 97.1 /100 | #110 | Exceptional 94.5% |
| Immigrants | Zimbabwe | 96.8 /100 | #111 | Exceptional 94.4% |
| Immigrants | Kuwait | 96.8 /100 | #112 | Exceptional 94.4% |
| Palestinians | 96.5 /100 | #113 | Exceptional 94.4% |
| German Russians | 96.3 /100 | #114 | Exceptional 94.4% |
| Delaware | 96.3 /100 | #115 | Exceptional 94.4% |
| Sioux | 96.2 /100 | #116 | Exceptional 94.4% |
| Immigrants | Hungary | 95.8 /100 | #117 | Exceptional 94.4% |
| Jordanians | 95.6 /100 | #118 | Exceptional 94.4% |