Tongan vs Immigrants from the Azores 10th Grade
COMPARE
Tongan
Immigrants from the Azores
10th Grade
10th Grade Comparison
Tongans
Immigrants from the Azores
93.3%
10TH GRADE
9.5/ 100
METRIC RATING
220th/ 347
METRIC RANK
89.0%
10TH GRADE
0.0/ 100
METRIC RATING
332nd/ 347
METRIC RANK
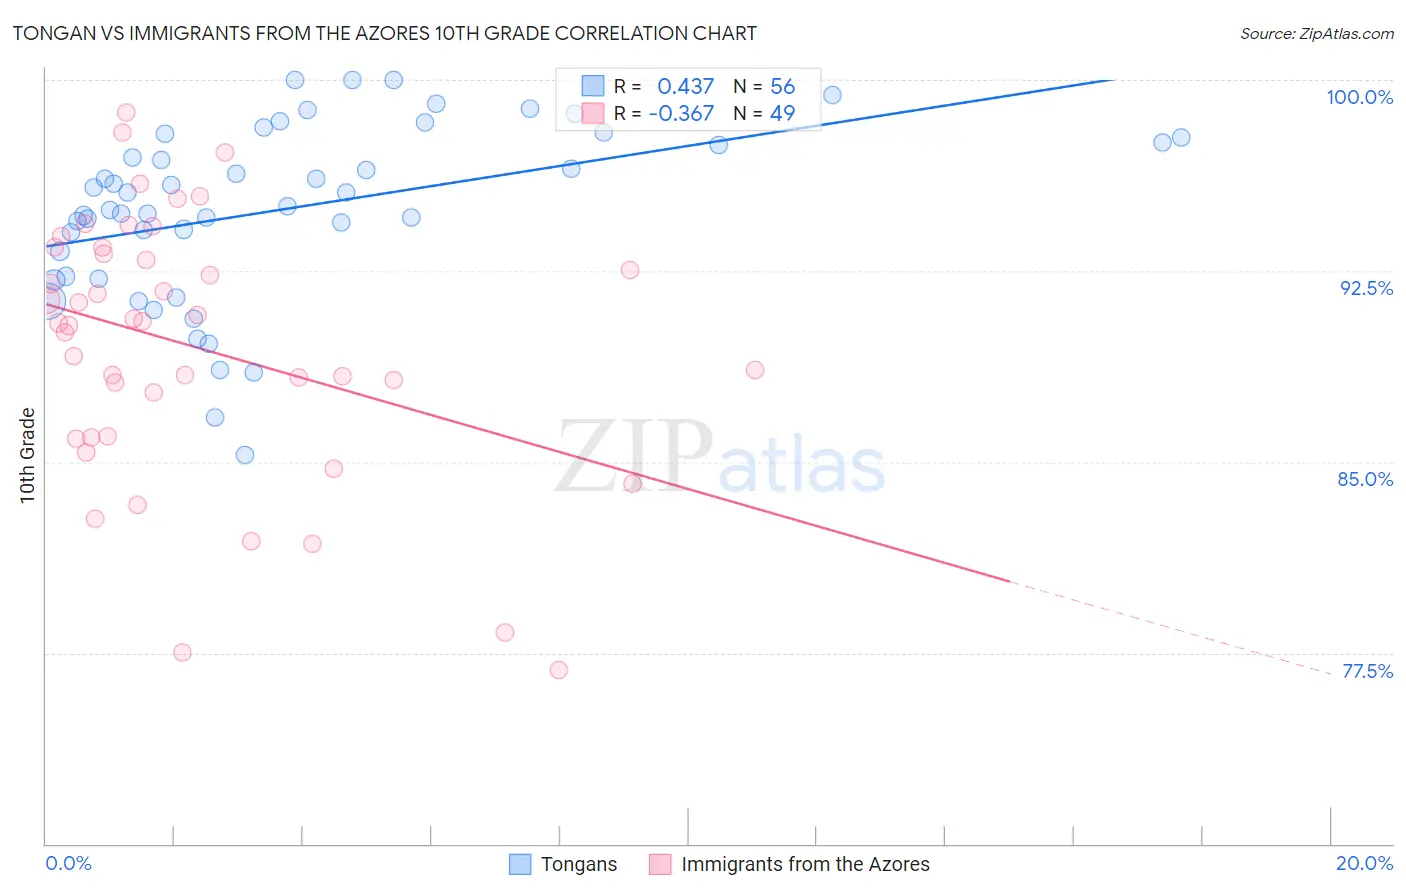
Tongan vs Immigrants from the Azores 10th Grade Correlation Chart
The statistical analysis conducted on geographies consisting of 102,873,790 people shows a moderate positive correlation between the proportion of Tongans and percentage of population with at least 10th grade education in the United States with a correlation coefficient (R) of 0.437 and weighted average of 93.3%. Similarly, the statistical analysis conducted on geographies consisting of 46,257,310 people shows a mild negative correlation between the proportion of Immigrants from the Azores and percentage of population with at least 10th grade education in the United States with a correlation coefficient (R) of -0.367 and weighted average of 89.0%, a difference of 4.8%.
10th Grade Correlation Summary
| Measurement | Tongan | Immigrants from the Azores |
| Minimum | 85.3% | 76.8% |
| Maximum | 100.0% | 98.7% |
| Range | 14.7% | 21.9% |
| Mean | 94.9% | 89.5% |
| Median | 95.3% | 90.5% |
| Interquartile 25% (IQ1) | 92.8% | 86.0% |
| Interquartile 75% (IQ3) | 97.7% | 93.3% |
| Interquartile Range (IQR) | 4.9% | 7.3% |
| Standard Deviation (Sample) | 3.4% | 5.1% |
| Standard Deviation (Population) | 3.4% | 5.1% |
Similar Demographics by 10th Grade
Demographics Similar to Tongans by 10th Grade
In terms of 10th grade, the demographic groups most similar to Tongans are Immigrants from Liberia (93.3%, a difference of 0.020%), Seminole (93.3%, a difference of 0.020%), Immigrants from Southern Europe (93.2%, a difference of 0.020%), Ethiopian (93.2%, a difference of 0.050%), and Immigrants from Sierra Leone (93.2%, a difference of 0.050%).
| Demographics | Rating | Rank | 10th Grade |
| Immigrants | Asia | 15.7 /100 | #213 | Poor 93.4% |
| Immigrants | Bahamas | 15.2 /100 | #214 | Poor 93.4% |
| Immigrants | Oceania | 15.1 /100 | #215 | Poor 93.4% |
| Immigrants | Eastern Africa | 14.7 /100 | #216 | Poor 93.4% |
| Portuguese | 12.1 /100 | #217 | Poor 93.3% |
| Immigrants | Liberia | 10.2 /100 | #218 | Poor 93.3% |
| Seminole | 10.2 /100 | #219 | Poor 93.3% |
| Tongans | 9.5 /100 | #220 | Tragic 93.3% |
| Immigrants | Southern Europe | 8.9 /100 | #221 | Tragic 93.2% |
| Ethiopians | 7.9 /100 | #222 | Tragic 93.2% |
| Immigrants | Sierra Leone | 7.6 /100 | #223 | Tragic 93.2% |
| Bolivians | 6.7 /100 | #224 | Tragic 93.2% |
| Somalis | 6.2 /100 | #225 | Tragic 93.2% |
| Koreans | 6.1 /100 | #226 | Tragic 93.2% |
| Blacks/African Americans | 6.0 /100 | #227 | Tragic 93.2% |
Demographics Similar to Immigrants from the Azores by 10th Grade
In terms of 10th grade, the demographic groups most similar to Immigrants from the Azores are Honduran (89.0%, a difference of 0.030%), Mexican American Indian (89.0%, a difference of 0.040%), Immigrants from Yemen (89.1%, a difference of 0.070%), Hispanic or Latino (88.9%, a difference of 0.15%), and Immigrants from Dominican Republic (88.7%, a difference of 0.33%).
| Demographics | Rating | Rank | 10th Grade |
| Puerto Ricans | 0.0 /100 | #325 | Tragic 89.8% |
| Central American Indians | 0.0 /100 | #326 | Tragic 89.7% |
| Immigrants | Nicaragua | 0.0 /100 | #327 | Tragic 89.5% |
| Immigrants | Cabo Verde | 0.0 /100 | #328 | Tragic 89.5% |
| Dominicans | 0.0 /100 | #329 | Tragic 89.4% |
| Immigrants | Yemen | 0.0 /100 | #330 | Tragic 89.1% |
| Mexican American Indians | 0.0 /100 | #331 | Tragic 89.0% |
| Immigrants | Azores | 0.0 /100 | #332 | Tragic 89.0% |
| Hondurans | 0.0 /100 | #333 | Tragic 89.0% |
| Hispanics or Latinos | 0.0 /100 | #334 | Tragic 88.9% |
| Immigrants | Dominican Republic | 0.0 /100 | #335 | Tragic 88.7% |
| Immigrants | Honduras | 0.0 /100 | #336 | Tragic 88.5% |
| Central Americans | 0.0 /100 | #337 | Tragic 88.4% |
| Immigrants | Latin America | 0.0 /100 | #338 | Tragic 88.3% |
| Guatemalans | 0.0 /100 | #339 | Tragic 87.9% |