Honduran vs Immigrants from Zimbabwe 10th Grade
COMPARE
Honduran
Immigrants from Zimbabwe
10th Grade
10th Grade Comparison
Hondurans
Immigrants from Zimbabwe
89.0%
10TH GRADE
0.0/ 100
METRIC RATING
333rd/ 347
METRIC RANK
94.4%
10TH GRADE
96.8/ 100
METRIC RATING
111th/ 347
METRIC RANK
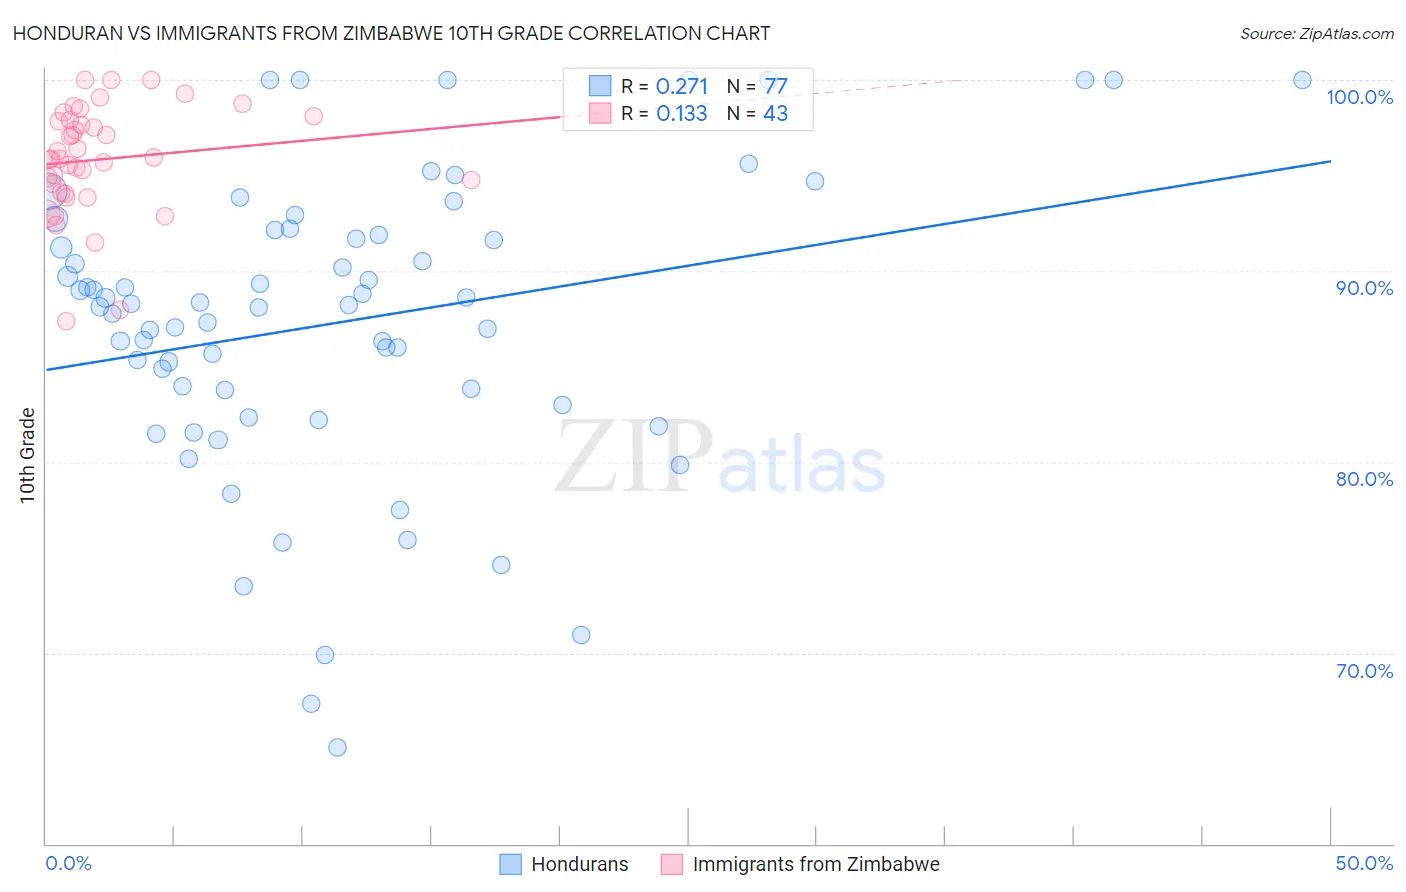
Honduran vs Immigrants from Zimbabwe 10th Grade Correlation Chart
The statistical analysis conducted on geographies consisting of 357,858,827 people shows a weak positive correlation between the proportion of Hondurans and percentage of population with at least 10th grade education in the United States with a correlation coefficient (R) of 0.271 and weighted average of 89.0%. Similarly, the statistical analysis conducted on geographies consisting of 117,809,691 people shows a poor positive correlation between the proportion of Immigrants from Zimbabwe and percentage of population with at least 10th grade education in the United States with a correlation coefficient (R) of 0.133 and weighted average of 94.4%, a difference of 6.2%.
10th Grade Correlation Summary
| Measurement | Honduran | Immigrants from Zimbabwe |
| Minimum | 65.0% | 87.3% |
| Maximum | 100.0% | 100.0% |
| Range | 35.0% | 12.7% |
| Mean | 87.3% | 95.8% |
| Median | 88.2% | 95.9% |
| Interquartile 25% (IQ1) | 83.4% | 94.1% |
| Interquartile 75% (IQ3) | 92.0% | 97.9% |
| Interquartile Range (IQR) | 8.6% | 3.8% |
| Standard Deviation (Sample) | 7.7% | 2.8% |
| Standard Deviation (Population) | 7.7% | 2.8% |
Similar Demographics by 10th Grade
Demographics Similar to Hondurans by 10th Grade
In terms of 10th grade, the demographic groups most similar to Hondurans are Immigrants from the Azores (89.0%, a difference of 0.030%), Mexican American Indian (89.0%, a difference of 0.070%), Immigrants from Yemen (89.1%, a difference of 0.10%), Hispanic or Latino (88.9%, a difference of 0.12%), and Immigrants from Dominican Republic (88.7%, a difference of 0.30%).
| Demographics | Rating | Rank | 10th Grade |
| Central American Indians | 0.0 /100 | #326 | Tragic 89.7% |
| Immigrants | Nicaragua | 0.0 /100 | #327 | Tragic 89.5% |
| Immigrants | Cabo Verde | 0.0 /100 | #328 | Tragic 89.5% |
| Dominicans | 0.0 /100 | #329 | Tragic 89.4% |
| Immigrants | Yemen | 0.0 /100 | #330 | Tragic 89.1% |
| Mexican American Indians | 0.0 /100 | #331 | Tragic 89.0% |
| Immigrants | Azores | 0.0 /100 | #332 | Tragic 89.0% |
| Hondurans | 0.0 /100 | #333 | Tragic 89.0% |
| Hispanics or Latinos | 0.0 /100 | #334 | Tragic 88.9% |
| Immigrants | Dominican Republic | 0.0 /100 | #335 | Tragic 88.7% |
| Immigrants | Honduras | 0.0 /100 | #336 | Tragic 88.5% |
| Central Americans | 0.0 /100 | #337 | Tragic 88.4% |
| Immigrants | Latin America | 0.0 /100 | #338 | Tragic 88.3% |
| Guatemalans | 0.0 /100 | #339 | Tragic 87.9% |
| Mexicans | 0.0 /100 | #340 | Tragic 87.8% |
Demographics Similar to Immigrants from Zimbabwe by 10th Grade
In terms of 10th grade, the demographic groups most similar to Immigrants from Zimbabwe are Immigrants from Kuwait (94.4%, a difference of 0.010%), Burmese (94.5%, a difference of 0.020%), Palestinian (94.4%, a difference of 0.020%), Immigrants from North Macedonia (94.5%, a difference of 0.030%), and Immigrants from Norway (94.5%, a difference of 0.030%).
| Demographics | Rating | Rank | 10th Grade |
| Immigrants | Romania | 97.5 /100 | #104 | Exceptional 94.5% |
| Immigrants | Turkey | 97.4 /100 | #105 | Exceptional 94.5% |
| Immigrants | Serbia | 97.4 /100 | #106 | Exceptional 94.5% |
| Immigrants | Croatia | 97.4 /100 | #107 | Exceptional 94.5% |
| Immigrants | North Macedonia | 97.2 /100 | #108 | Exceptional 94.5% |
| Immigrants | Norway | 97.2 /100 | #109 | Exceptional 94.5% |
| Burmese | 97.1 /100 | #110 | Exceptional 94.5% |
| Immigrants | Zimbabwe | 96.8 /100 | #111 | Exceptional 94.4% |
| Immigrants | Kuwait | 96.8 /100 | #112 | Exceptional 94.4% |
| Palestinians | 96.5 /100 | #113 | Exceptional 94.4% |
| German Russians | 96.3 /100 | #114 | Exceptional 94.4% |
| Delaware | 96.3 /100 | #115 | Exceptional 94.4% |
| Sioux | 96.2 /100 | #116 | Exceptional 94.4% |
| Immigrants | Hungary | 95.8 /100 | #117 | Exceptional 94.4% |
| Jordanians | 95.6 /100 | #118 | Exceptional 94.4% |